Figure 3.

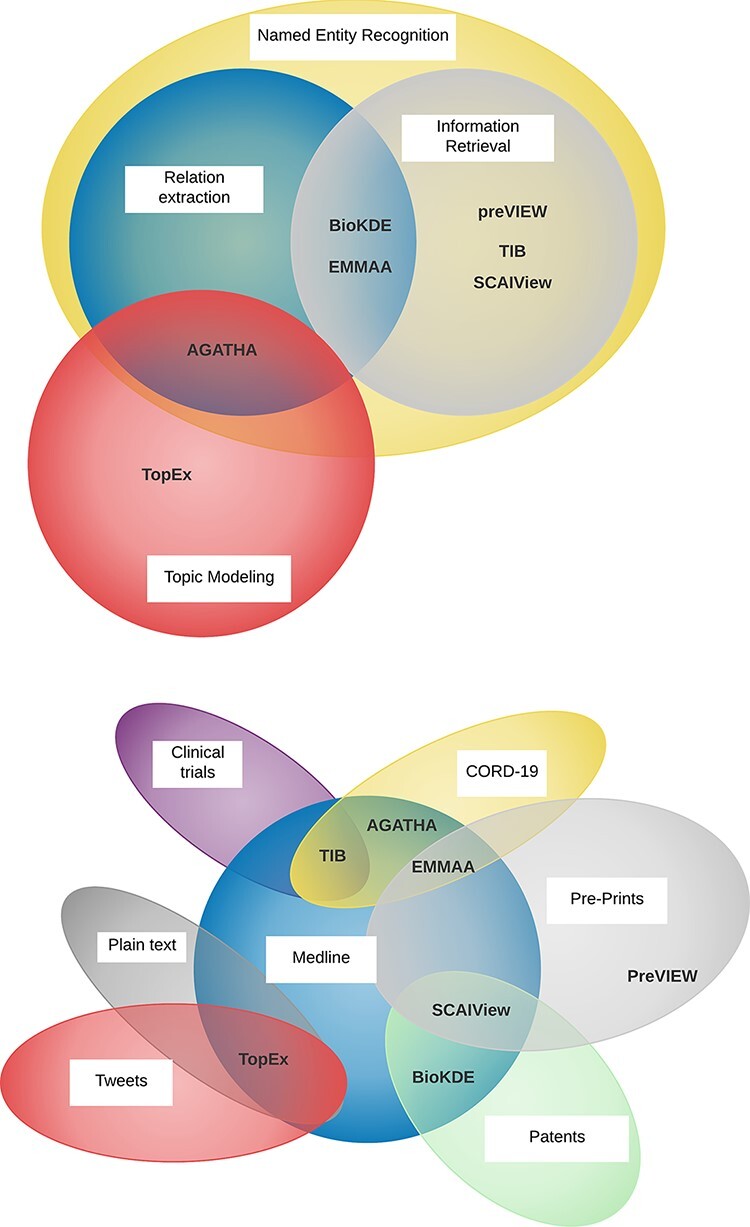
Venn diagrams showing the diversity of the tasks performed by the participating NLP teams (top) and the various sources of textual data (bottom).

Venn diagrams showing the diversity of the tasks performed by the participating NLP teams (top) and the various sources of textual data (bottom).