Figure 4.

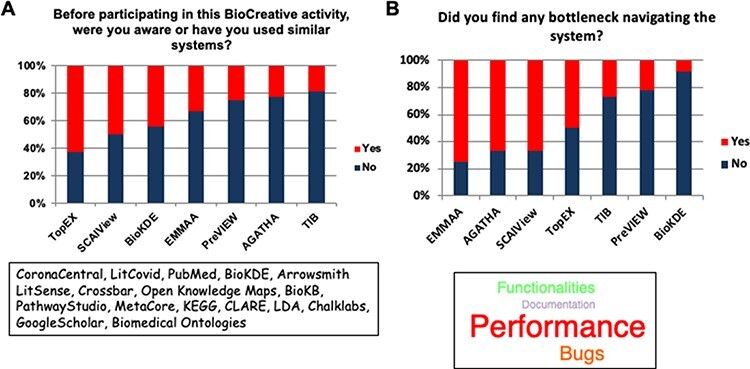
The two bar plots display the familiarity of the users with systems similar to the ones participating in Track IV (A) and the most common bottlenecks encountered in the evaluation of the systems (B).

The two bar plots display the familiarity of the users with systems similar to the ones participating in Track IV (A) and the most common bottlenecks encountered in the evaluation of the systems (B).