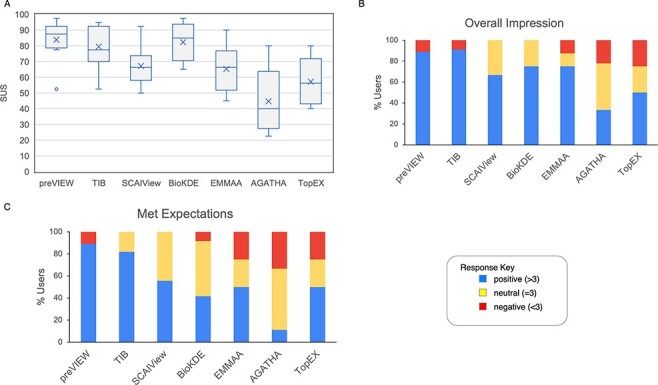
Figure 6.

Results from questions evaluated with a Likert scale. (A) The boxplot represents the SUS distribution for each system. The X represents the mean, the horizontal line within the box is the median and the circle is an outlier. (B) Aggregate response to the ‘Overall impression’ for the systems. Scores >3, <3 and =3 were labeled as positive, negative and neutral impression, respectively. (C) Aggregate response to the question ‘meeting expectations’.
