

Abstract
Background.
Because of their remoteness, Mountain Communities (MC) have been considered at advantage when dealing with infectious diseases. However, earlier reports have identified MC among the hotspots for early spreading of COVID-19 pandemic.
Methods.
Crude mortality rates (CMR) and Excess mortality rates (EMR) were calculated for 97 municipalities from MC in the Emilia Romagna Region (North-Eastern Italy), and resulting estimates were compared to the Parent Provinces. Notification and mortality rates for COVID-19 were also retrieved, and correlated with EMR estimates.
Results.
During 2020, a CMR of 150.3/100,000 (95% Confidence Interval [95%CI] 117-185.4) was identified, with substantial heterogeneities between the 8 provinces of Emilia Romagna Region that were included in the analyses. A pooled EMR of +20.3% (95%CI 10.6-30.1) for MC and 19.9% (95%CI 9.5-30.3) was identified. The monthly estimates were quite heterogenous across the various provinces, ranging between -79.7% and +307.4% during the assessed timeframe. Higher estimates were identified in the months of March and April in MC, and during the months of April and May for Parent Provinces. In bivariate analysis, EM in MC was loosely but positively correlated with estimates in the parent province (Spearman’s r = 0.201, p = 0.049), and also with notification rates for COVID- (i.e. Piacenza, Parma, Reggio Emilia, Modena, Bologna, Ravenna, Rimini, and Forlì Cesena) (r = 0.225, p = 0.045), and particularly with mortality rates for COVID-19 at provincial level (r = 0.372, p < 0.001).
Conclusions.
In summary, the study highlights that small geographical and population size, along with remoteness, did not play a substantial advantage for MC against the spread and mortality rate of COVID-19. On the other hand, as the surge of EM in MC anticipated a similar habit in Parent Provinces of several weeks, improved surveillance interventions are also urgently in need. (www.actabiomedica.it)
Keywords: case fatality rate, Coronavirus, Mountain, Apennines, mortality, syndemic, mortality rates, excess mortality rates
Introduction
Small geographical size and remoteness, even when facing restricted availability of medical resources, could represent a substantial advantage when dealing with epidemics of emerging infectious diseases (1–4). Regarding the ongoing SARS-CoV-2 pandemic, most of available evidence stems from Small Islands States of the Pacific, whose small geographical and population sizes, coupled with the appropriate implementation of non-pharmaceutical interventions (NPI), have guaranteed to the local communities some advantage in the early containment of viral spread (2–6).
Even though some Mountain Areas may be perceived as geographically isolated as island ones, local communities in Europe and North America have been initially identified as hotspots for viral spreading in the early stages of the pandemic, and several factors have contributed to this clearly unwanted role (1). First of all, in North America and Western Europe the earlier stages of the “first wave” of SARS-CoV-2 pandemic (i.e. end February – May/June 2020, for most of Western Europe) occurred at the end of the winter tourist season (1,7,8). In this context, a combination of low risk perception among tourists and local Authorities, and the high influx of individuals from geographical areas that had been unbeknownst entry gates of this new pathogen in Western Countries, contributed to the rapid spread of the pathogen, not only locally but also at international level. Interestingly enough, even in the wake of the “First Wave”, immediately after the implementation of NPI and lockdown measures, and the eventual shutdown of tourist resorts, some mountain municipalities have performed particularly well in containing the rate of new cases and incident deaths, stressing the advantage of remoteness when communities are asked to implement physical containment measures (7,8).
However, when dealing with such information, a precautionary approach is forcibly needed. In fact, the earlier stages of the pandemic were characterized by a substantial lack of diagnostic options, and a large share of incident cases and deaths were not properly identified (9,10). In this case, the remoteness of mountain areas may have contributed to a substantial underscoring of the actual SARS-CoV-2 burden of disease. A suitable option to cope with this potential issue is represented by the calculation of the “excess mortality” (EM), i.e. the percent difference between the reported number of deaths (RD) in a given month, and an estimate of the expected deaths (ED) for that period (11).
From this point of view, analysis of EM in Italian Mountain Communities may provide some interesting insights, and particularly in those from Emilia Romagna Region. Emilia Romagna is one of the 20 main administrative regions of Italy, with an area of 22,446 km2 (8,666 sq mi), and a total population of around 4.4 million inhabitants. On the one hand, nearly more than half of the total surface of the region is either hilly (27%) or mountainous (25%), with a mountain range stretching for more than 300 km, and including a total of 97 Municipalities that were located at 600 m or more above sea level, being therefore acknowledged as “Mountain Communities” (MC) according to the Italian Law (Law 991/1952). On the other hand, during the first semester of 2020, western Provinces of Emilia Romagna Region (i.e. Piacenza, Parma, Reggio Emilia, and Modena) being extensively interconnected with nearby regions of Lombardy, Veneto and Piedmont, were severely involved in the “first wave” of SARS-CoV-2 pandemic, while eastern provinces of Bologna, Ferrara, Ravenna, Forlì-Cesena and Rimini were more marginally affected (10,12–15). Moreover, while other Regions of Northern Italy are substantially involved in the winter tourism, MC of Emilia Romagna do not represent significant tourist locations during the winter season: in other words, the characterization of the early stages of SARS-CoV-2 pandemic in these areas should limitedly depend on international influx of new infection, being rather an early index for the local dynamics of COVID-19 pandemic.
Still, few studies have specifically examined the impact of SARS-CoV-2 pandemic on Italian MC (16): in order to fill this information gap, this study will therefore compare mortality data from all cases over 12 months (January to December, 2020) in 97 municipalities from Emilia Romagna Region fulfilling the statutory definition of MC (Annex Figure A1).
2. Materials and Methods
2.1. Background.
Italy has a total surface of 301,230 km2, with a total population of around 60,000,000 inhabitants. The first-level administrative entities are represented by the Regions (No. 20); each region is divided in a number of provinces (No. 107, including: 80 ordinary provinces, 2 autonomous provinces, 4 regional decentralization entities, 6 free municipal consortia, 14 metropolitan cities, as well as the Aosta Valley Region, where region and province coincide), that in turn include several municipalities (in Italian, “comune”; No. 7,904 by March 18, 2022), that vary considerably in size and population, both as for total population and population density. According to the Italian Law No. 991/1952, a municipality may be acknowledged as a Mountain Community if: a) ≥ 80% of the total surface is located 600 m or more above sea level, b) the difference between the highest and lowest points is equals to 600 m or greater, irrespective of the total surface. In Emilia Romagna (Regional Law No. 2/2004, and No. 25/2017), a total of 97 municipalities in 2020 could be acknowledged as MC (See Supplementary Table A1 and Supplementary Figure A1).
2.2. Population data.
Italian Institute of Statistics (ISTAT; https://demo.istat.it) provides open-source data including population estimates at various administrative levels (i.e. National, Regional, Provincial and/or Municipality). More precisely, we retrieved monthly estimates from the timeframe 2018 – 2020 about: (a) resident population at Provincial and Municipality level; (b) monthly estimates for deaths among residents at Provincial and Municipality level.
2.3. Data about COVID-19.
Open-source provincial-level estimates for SARS-CoV-2 infections are regularly provided by the official website of the Italian National Institute for Nuclear Physics (INFN) at provincial level. In this study, monthly provincial estimates for COVID-19 notification rates were retrieved for 2020.
2.4. Statistical analysis.
Firstly, a descriptive analysis of annual crude mortality rates at municipal level was performed. Municipality-level estimates were then pooled at provincial level in order to confront them with similar data from the parent province. Excess mortality (EM), i.e. the difference between the reported number of deaths (RD) in a given month in 2020, and an estimate of the expected deaths (ED) for that period, was then calculated as follows:
EM = (RDi - EDi,a, 2018-2019) / EDi,a, 2018-2019
RDi,a = reported deaths in a given month i, at a specific administrative level a
EDi,a, 2018-2019 = average deaths in a given month i for the time period 2018-2019, at a specific administrative level a
Average monthly estimates for COVID-19 notification rates were then calculated at provincial level in order to compare correspondent estimates with mortality and EM from the MC after their pooling at provincial level. Comparisons of crude rates were performed by means of Mann-Whitney or Kruskal-Wallis test for multiple independent samples, while the association between continuous variables was assessed through Spearman’s rank correlation coefficient.
All calculation were performed on R 4.0.3 (17), by means of packages epiR (v. 2.0.19), EpiReport (v 1.0.1), fmsb (0.7.0).
Ethical approval. No ethical approval was needed for this study, as no individual data were identifiable, and only aggregated data were analyzed and presented.
3. Results
3.1. Demographics of MC
Between January 1st, 2018, and December 31st, 2020, the average population of the 97 MC included in the study was 313,048.0 ± 1053.2 inhabitants (Table 1, Annex Table A1), equals to 7.0% of the total population of Emilia Romagna Region. The greater share of sampled population (105120.3 ± 131.0, 33.6% of the total) was from the Province of Bologna, that also encompassed the larger share of municipalities (21, 21.6%), followed by Modena (62644.6 ± 184.8, 20.0%), Reggio Emilia (43071.2 ± 243.4, 13.8%), Parma (38930.8 ± 290.9, 12.4%), Forlì Cesena (32080.5 ± 223.4, 10.2%), Rimini (17023.8 ± 123.6, 5.4%), Piacenza (11655.5 ± 153.4, 3.7%), and eventually Ravenna, as the latter Province included only one municipality for a total of 2521.1 ± 29.7 inhabitants (0.8%).
Table 1.
General characteristics of the sampled communities.
| Province | Mountainous Communities (No.) | % | Population (2018-2020) (Average [SD]) | % | Deaths (No.) | % |
|---|---|---|---|---|---|---|
| Total | 97 | 100% | 313048.0 (1053.2) | 100% | 13889 | 100% |
| Piacenza | 10 | 10.3% | 11655.5 (153.4) | 3.7% | 890 | 6.4% |
| Parma | 20 | 20.6% | 38930.8 (290.9) | 12.4% | 2173 | 15.6% |
| Reggio Emilia | 10 | 10.3% | 43071.2 (243.4) | 13.8% | 2017 | 14.5% |
| Modena | 17 | 17.5% | 62644.6 (184.8) | 20.0% | 2537 | 18.3% |
| Bologna | 21 | 21.6% | 105120.3 (131.0) | 33.6% | 4238 | 30.5% |
| Ravenna | 1 | 1.3% | 2521.1 (29.7) | 0.8% | 36 | 0.3% |
| Forlì-Cesena | 11 | 11.3% | 32080.5 (223.4) | 10.2% | 1335 | 9.6% |
| Rimini | 7 | 7.2% | 17023.8 (123.6) | 5.4% | 663 | 4.8% |
Similarly, the greater share of deaths was from the municipalities in province of Bologna (30.5%), followed by Modena (18.3%), Parma (15.6%), Reggio Emilia (14.5%), Forlì Cesena (9.6%), Piacenza (6.4%), Rimini (4.8%), and Ravenna (0.3%).
As shown in Table 2, pre-pandemic monthly mortality rates ranged from 99.3 per 100,000 (95%CI 83.8 to 114.8) for the province of Rimini in 2019, to 204.3 per 100,000 (95%CI 183.9 to 224.8) in the province of Piacenza in 2018. Focusing on 2020, the lower mortality rates were reported from the MC of the province of Modena (117.9, 95%CI 106.9 to 129.0), with highest rates from the province of Piacenza (239.4, 95%CI 180.9-297.9).
Table 2.
Monthly mortality rates (reported as events per 100,000 persons) with corresponding 95% Confidence intervals for the mountain communities of Piacenza, Parma, Reggio Emilia, Modena, Bologna, Ravenna, Rimini, and Forlì Cesena in 2018, 2019, and 2020.
| Monthly Mortality Rates (per 100,000, 95% Confidence Interval) | |||
|---|---|---|---|
| 2018 | 2019 | 2020 | |
| Piacenza | 204.3 (183.9; 224.8) | 192.9 (175.8; 210.1) | 239.4 (180.9; 297.9) |
| Parma | 137.6 (125.4; 149.8) | 147.5 (133.7; 161.3) | 180.2 (124.7; 235.6) |
| Reggio Emilia | 129.0 (112.6; 145.4) | 122.1 (112.6; 131.5) | 139.2 (115.3; 163.1) |
| Modena | 110.4 (99.2; 121.6) | 109.1 (100.2; 118.1) | 117.9 (106.9; 129.0) |
| Bologna | 108.5 (96.8; 120.2) | 103.5 (97.2; 109.9) | 123.9 (109.8; 138.0) |
| Ravenna | 140.2 (100.7; 179.7) | 125.8 (82.1; 169.6) | 153.7 (117.8; 189.5) |
| Forlì Cesena | 110.1 (102.4; 117.7) | 110.1 (95.0; 125.2) | 126.7 (112.3; 141.2) |
| Rimini | 104.4 (89.6; 119.2) | 99.3 (83.8; 114.8) | 121.0 (107.2; 134.8) |
| POOLED | 130.6 (104.4; 156.7) | 126.3 (101.5; 151.1) | 150.3 (117.0; 183.5) |
Still, if the analyses were limited to the months of March and April 2020 (i.e. when lockdown measures were strictly implemented in the whole of Italy), mortality rates were substantially increased in Parent Provinces compared to MC (173.1 per 100,000, 95%CI 121.2-225.0 vs. 210.1 per 100,000, 95%CI 139.5-280.7, p = 0.025), while estimates for EM remained comparable (+56.7%, 95%CI 23.2-90.2 vs. +68.5%, 95%CI 4.1-132.8; p = 0.694), but not correlated (r = 0.103, p = 0.727).
Nonetheless, when the Risk Ratios (RR) for monthly deaths in mountain communities were plotted (Figure 1), a specific trend was seemingly suggested. In fact, RR for all-causes death was substantially increased in the sampled MC compared to the Parent Provinces, across the whole of the assessed timeframe, as it ranged between 1.193 (95%CI 1.064 to 1.338; September 2020) and RR 1.398 (April 2019, 95%CI 1.256 to 1.555), with a pooled estimate of 1.306, 95%CI 1.281-1.330 (I2 = 8.4, Q = 38.2, p = 0.326).
Figure 1.
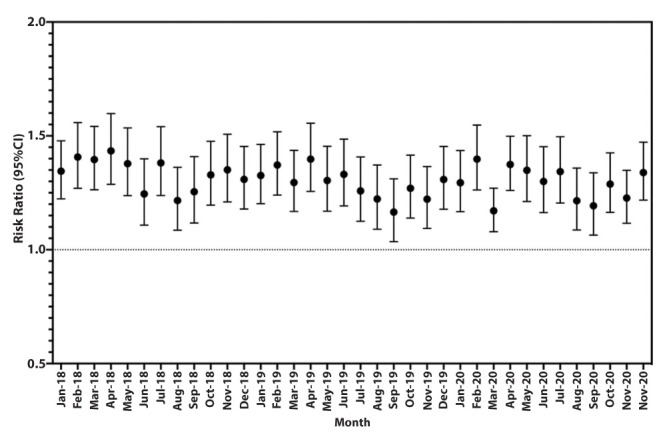
Time trend of the Risk Ratio (RR) for mortality in Mountain Communities compared to the Parent Provinces (Piacenza, Parma, Reggio Emilia, Modena, Bologna, Ravenna, Rimini, and Forlì Cesena) between January 2018 and December 2021. A pooled RR equals to 1.306, 95%CI 1.281- 1.330 (I2 = 8.4, Q = 38.2, p = 0.326) was eventually calculated.
3.2. Excess Mortality
EM were initially pooled at provincial level (Figure 2), and a specific pattern was identified, with a certain west-to-east trend. More precisely, the western provinces – and particularly Piacenza and Parma, and also Reggio Emilia were characterized by increased EM rates during the months of April (+347.4%, +275.7%, and +81.2%, respectively), and May (+112.4%, +111.2%, and +79.1%, respectively).
Figure 2.

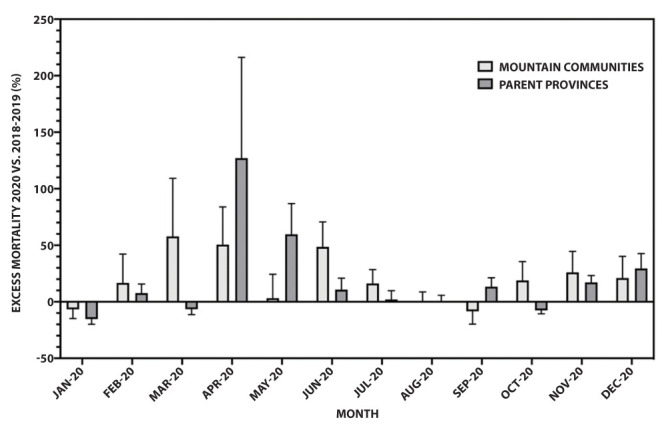
Excess Mortality 2020 vs. 2018-2019 in mountain communities (black) vs. Parent Provinces (grey) of Emilia Romagna Region. Estimates included a total of 10 municipalities from Piacenza, 20 from Parma, 10 from Reggio Emilia, 17 from Modena, 21 from Bologna, 7 from Rimini, 11 from Forlì Cesena, only one community from Ravenna.
By moving eastwards, the increase of EM progressively diminished (+76.2% in March and +22.6% in April for Modena; +44.5% and +55.4% for Bologna; +25.6% and +23.3% in Ravenna), with a resurgence in the south-eastern provinces of Forlì Cesena (+50.1%, and 31.8%), and Rimini (+115.8%, and +43.6%).
Interestingly enough, MC of Piacenza and Parma were characterized by earlier surge of EM rates, that peaked in the month of March (+183.0%, and +136.3% for Piacenza and Parma, respectively), and then decreased in the following months of April (+75.7% and +133.9%, respectively), and May (-10.7%, and +5.9%). While nearby provinces of Reggio Emilia (+68.8% in March, +48.7% in April, and -13.7% in May) and Modena (+25.2% in March, +27.1% in April, 8.3% in May) exhibited a similar but milder trend, it was unnoticeable in more eastern MC (i.e. areas that were more distant from the COVID-19 hotspots of Southern Lombardy).
When estimates were pooled by the reporting month (see Figure 3), during March 2020 (i.e. the first wave of the pandemic), MC exhibited an increased EM (i.e. +57.8%, 95%CI +6.5 to +109.2 vs. -6.6%, 95%CI -1.8 to +11.4) compared to the other areas of the Parent Provinces, that were affected by a substantial surge of EM rates during the following months of April and May (+127.1%, 95%CI +38.0 to +216.1; +59.7%, 95%CI +32.5 to +86.9). Early months of the warm season (i.e. June and July) were characterized by higher rates for EM in MC (+48.6%, 95%CI +26.5 to +70.7, and +16.2%, 95%CI +3.9 to +28.5) than in Parent Provinces (+10.7%, 95%CI +0.6 to 20.8, and +2.1%, 95%CI -5.6 to +9.8), and again in the months of October (+18.9%, 95%CI +2.3 to +35.5 vs. -7.6%, 95%CI -10.6 to 4.5) and November (+26.0%, 95%CI +7.4 to 44.5 vs. +17.1%, 95%CI +11.0 to +23.2). However, no substantial difference was eventually identified (Wilcoxon matched-pairs signed rank test p value = 0.622).
Figure 3.
Excess Mortality (2020 vs. 2018-2019) for Mountain Communities (MC) vs. Parent Provinces of Piacenza, Parma, Reggio Emilia, Modena, Bologna, Ravenna, Rimini, and Forlì Cesena.
When monthly estimates were pooled at provincial level (Table 3), MC from Western Provinces of Piacenza and Parma (i.e. those that were more severely affected by SARS-CoV-2 in the early stages of the pandemic), but also Reggio Emilia and Modena, had lower EM rates than those reported in the parent province (i.e. +22.1% vs. +41.2%, p = 0.519 for Piacenza; +23.5% vs. +35.4% for Parma, p = 0.380; +11.4% vs. +15.5% for Reggio Emilia, p = 0.719; +8.6% vs. +14.1% for Modena, p = 0.622). On the contrary, in the MC of the Eastern areas of Bologna, Ravenna, Ferrara, Forlì-Cesena a specular trend was identified, with local municipalities exhibiting increasing estimates for EM across all of the calendar year 2020 compared to 2018-2019 (i.e. Bologna +17.7% vs. +9.9%, p = 0.064; Ravenna +37.9% vs. +8.4%, p = 0.519; Rimini +24.1% vs. 22.1%, p = 0.470; Forlì Cesena +17.4% vs. 12.5%, p = 0.910), and again the difference was not significant. In fact, correspondent pooled estimates of +20.3% (95%CI +10.6 to +30.1) for the whole of MC and +19.9% (+9.5 to +30.3) for Parent Provinces were eventually calculated, and the difference was not significant (p = 0.819).
Table 3.
Monthly average of excess mortality estimated in 2020 compared to the biennial estimates for 2018-2019 in mountain communities of Piacenza, Parma, Reggio Emilia, Modena, Bologna, Ravenna, Rimini, and Forlì Cesena, compared to the Parent Provinces. Comparisons were performed by means of Wilcoxon matched-pairs signed rank test.
| Excess mortality (%, 95%CI), monthly average | |||
|---|---|---|---|
| Mountain Communities | Parent Province | P value | |
| Piacenza | +22.1% (-13.8; 58.0) | +41.2% (-23.8; 106.1) | 0.519 |
| Parma | +23.5% (-10.3; 57.2) | +35.4% (-16.9; 87.7) | 0.380 |
| Reggio Emilia | +11.4% (-6.4; 29.2) | +15.5% (-5.3; 36.2) | 0.791 |
| Modena | +8.6% (-3.2; 20.5) | +14.1% (-3.4; 31.7) | 0.622 |
| Bologna | +17.7% (3.0; 32.4) | +9.9% (-4.3; 24.1) | 0.064 |
| Ravenna | +37.9% (-24.0; 99.7) | +8.4% (-1.2; 18.1) | 0.519 |
| Forlì Cesena | +17.4% (-1.1; 35.8) | +12.5% (0.4; 24.5) | 0.910 |
| Rimini | +24.1% (0.1; 48.2) | +22.1% (-1.5; 45.7) | 0.470 |
| POOLED | +20.3% (10.6; 30.1) | +19.9% (9.5; 30.3) | 0.819 |
3.3. Bivariate analysis
In bivariate analysis, as shown in Figure 4, both mortality rates (Spearman’s r = 0.457, p < 0.001) and EM estimates of MC and Parent Provinces were positively correlated (r = 0.201, p = 0.049), i.e. higher the mortality in the parent province, higher the mortality rates in the mountain areas.
Figure 4.
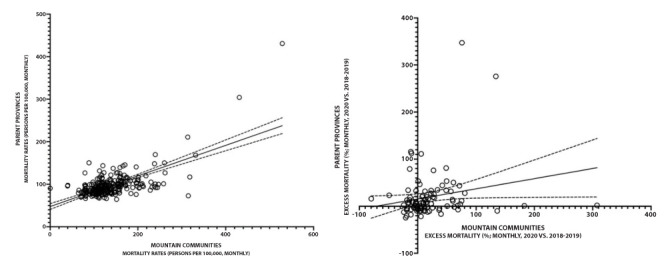
Monthly estimates of mortality (2018-2020; a) and Excess Mortality (2020 vs. 2018-2019; b) for mountain communities of Piacenza, Parma, Reggio Emilia, Modena, Bologna, Ravenna, Rimini, and Forlì Cesena, compared to the Parent Provinces. Both mortality rates (Spearman’s r = 0.457, p < 0.001) and Excess Mortality estimates (r = 0.201, p = 0.049) were positively correlated.
EM estimates in MC were positively correlated with notification rates for COVID-19 in the parent province (i.e. r = 0.225, p = 0.045), and more specifically with mortality rates, also at provincial level (r = 0.372, p < 0.001) (Figure 5; Annex Figure A2 and Annex Figure A3). In other words, increased occurrence of SARS-CoV-2 infections in the whole of the province was associated with an increase in the excess mortality 2020 vs. 2018-2019 in the mountain communities.
Figure 5.
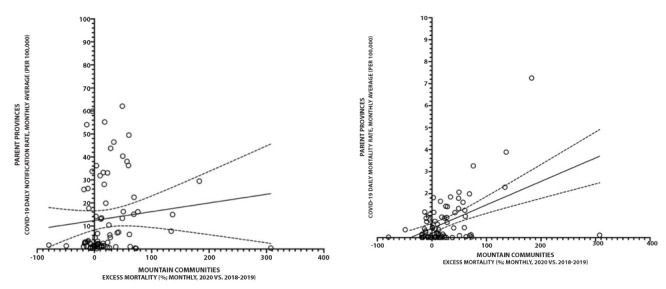
Correlation between monthly excess mortality in mountain communities of Emilia Romagna Region and: (a) notification rates for COVID-19 in Parent Provinces (i.e. Piacenza, Parma, Reggio Emilia, Modena, Bologna, Ravenna, Rimini, and Forlì Cesena) (Spearman’s r = 0.225, p = 0.045); (b) mortality rates for COVID-19 at provincial level (Spearman’s r = 0.372, p < 0.001).
4. Discussion
In this ecological study on MC from Emilia Romagna Region in North-Eastern Italy, mortality rates increased from 130.6 per 100,000 in 2018, and 126.3 per 100,000 in 2019 to 150.3 in 2020, a surge that mostly affected western provinces of Parma and Piacenza – i.e. the areas of Emilia Romagna that were more directly involved in the “first wave” of the SARS-CoV-2 pandemic (13–15). In fact, an EM equals to +20.3% (95%CI 10.6 to 30.1) was identified at regional level for the whole of MC, suggesting a substantial increase in incident deaths during 2020 compared to 2018 and 2019. Not only a similar increase was reported from the Parent Provinces (+19.9%, 95%CI 9.5 to 30.3, p = 0.819), but crude mortality rates and EM estimates in MC and Parent Provinces were each other positively correlated (Spearman’s r = 0.457, p < 0.001; and r = 0.201, p = 0.049, respectively).
Unfortunately, detailed estimates at municipal level for SARS-CoV-2 infections are to date unavailable, but provincial-level data for incidence and mortality were positively correlated with monthly EM estimates in MC (r = 0.225, p = 0.045 for SARS-CoV-2 incidence, and r = 0.372, p < 0.001 for mortality rates). In summary, MC have been seemly involved in the SARS-CoV-2 pandemic in a similar way to the Parent Provinces. However, when focusing on the monthly estimates, some specificities of MC do appear.
First of all, MC have been characterized by an increased risk for all-cause mortality well before the inception of SARS-CoV-2 pandemic (RR 1.306, 95%CI 1.281- 1.330 for the timeframe 2018-2020). This was not unexpected, as mountain areas in all of the Italian Peninsula are increasingly depopulated, with a progressively increasing share of older age groups over the total population (18,19), and this secular trend has most severely affected the Apennine ranges (20). Even if older mean age of MC compared to Parent Provinces should have resulted in the increased vulnerability of resident population to complications of SARS-CoV-2 infection (21–24), increased EM rates were identified only in the earlier stages of the pandemic, while estimates were highly comparable in the following months of 2020.
Second, MC were characterized by a rapid increase of EM estimates during the earlier months of the pandemic, and particularly in western provinces of Emilia Romagna, i.e. Parma and Piacenza. The geographical continuity with Southern Lombardy (i.e. the “hotspot” of SARS-CoV-2 pandemic in Italy during the “first wave”) may explain such estimates (10,25). In this regard, the analysis of EM rates in the calendar months of March and April 2020 seemly suggests that MC may have anticipated of around 30 days the surge in EM that has been linked to the COVID-19 pandemic in Parent Provinces (13,14,23). As our estimates are based on the all-causes mortality, we are unable to causally associate this surge with early introduction of SARS-CoV-2 infections. Moreover, MC in Emilia Romagna Region are hardly comparable to the mountain resorts that highly contributed to the earlier stages of the pandemic (1,26). Even though before the SARS-CoV-2 Pandemic Emilia Romagna region was among the top European Tourism Destinations, as it welcomed more than 11.5 million visitors annually (i.e. 50 million overnight stays) (27), Apennine Mountains and local resorts are only marginally involved in the winter tourism. Therefore, the surge in EM that was associated with MC compared to Parent Provinces was unlikely associated with an earlier introduction of the pathogen in the local communities, as in some previous reports from mountain resorts (1,7,8). In fact, the EM rates in MC and Parent Provinces were correlated across the assessed timeframe, as well as EM in MC with estimates for COVID-19 in Parent Provinces, suggesting a common background. A possible explanation could rather be found in a combination of limited availability of medical resources in mountain areas impacting on highly vulnerable populations. In other words, the higher mortality in the first weeks of the pandemic may have been caused by an early shortage of medical resources (28–30), that other areas of Parent Provinces may have been more proficient in dealing with. In other words, the scarce or reduced availability of intensive medical treatment, or even a delayed referral to health care facility able to provide intensive care may explain the earlier evidence of increased EM among MC compared to Parent Provinces. For the very same reason, MC have reasonably benefited the most from the implementation of lockdown measures and physical distancing, which have reasonably led to a rapid “exhaustion” of the “first wave” (31,32).
Limits. Our study is affected by several limitation that should be taken in account before any further generalization of our results. First of all, the present report is based on an ecological study, being therefore affected by all of the implicit limits of this design, and particularly the potentially confounding factors represented by individual level variables (33–35). The lack of detailed notification rates at municipal level for COVID-19 may have further amplified the implicit “ecological fallacy” associated with all ecological studies. In this regard, it should be stressed that during the first stages of the pandemic both incidence (or better, notification) rates and mortality rates for COVID-19 may have been largely under-reported (3,6), with estimates for lacked diagnoses that in certain areas may have accounted to 96% of actual cases (10). Therefore, while EM may represent a reliable proxy for COVID-19 mortality in the first year of the pandemic, when appropriate diagnostic options were less frequently available, all comparisons including laboratory diagnosis for SARS-CoV-2 should be more cautiously assessed (11).
Another obvious shortcoming of this study design is forcibly represented by the quality of the available data from online sources (i.e. dashboards, platforms and other ministerial sites) (36). For example, even though the all-causes mortality appears at relatively low risk of reporting bias (21), mortality rates are calculated on the number of residents, and this specific variable may be affected by substantial uncertainties. For example, some residents of MC in Emilia Romagna are in fact commuters and spend most of their active life in the largest city centers of the parent province. Following the progressive depopulation of Apennines, a large share of residents has in fact left MC but may retain the original and formal residence for fiscal reasons, in fact impairing the reliability of cumulative estimates (20).
5. Conclusions
In conclusion, MC of the Emilia Romagna Region have been impacted by the “first wave” of the SARS-CoV-2 pandemic similarly to their Parent Provinces. Interestingly, the impact of the pandemic on EM was noticeable in MC some weeks earlier than in Parent Provinces, and several specificities of these communities may have contributed to this habit. In other words, while remoteness has been often advocated as a preventive factor against infectious diseases, MC may represent a sort of “early indicator” for the accelerated stages of SARS-CoV-2 pandemic, representing a sort of “canary in a coal mine”. As a consequence, not only preventive measures are therefore forcibly required in order to protect resident population, but improved surveillance interventions may be quite useful in order to contribute to the quick characterization of the pandemic stages.
Acknowledgements:
The Author would like to thank Dr. Francesca DE NARD for their valuable support during the design and writing of the present paper.
Conflict of Interest:
The Author declares that he has no commercial associations (e.g. consultancies, stock ownership, equity interest, patent/licensing arrangement etc.) that might pose a conflict of interest in connection with the submitted article.
References
- Gianfredi V, Mauer NS, Gentile L, Riccò M, Odone A, Signorelli C. Covid-19 and recreational skiing: Results of a rapid systematic review and possible preventive measures. Int J Environ Res Public Health. 2021;18:4349. doi: 10.3390/ijerph18084349. [DOI] [PMC free article] [PubMed] [Google Scholar]
- Cuschieri S, Grech S. At-risk population for COVID-19: multimorbidity characteristics of a European small Island state. Public Health. 2021;192:33–6. doi: 10.1016/j.puhe.2020.12.012. [DOI] [PMC free article] [PubMed] [Google Scholar]
- Filho WL, Lütz JM, Sattler DN, Nunn PD. Coronavirus: COVID-19 transmission in pacific small island developing states. Int J Environ Res Public Health. 2020;17:5409. doi: 10.3390/ijerph17155409. [DOI] [PMC free article] [PubMed] [Google Scholar]
- Cuschieri S, Pallari E, Hatziyianni A, Sigurvinsdottir R, Sigfusdottir ID, SigurÐardóttir ÁK. A year of Covid-19: experiences and lessons learnt by small European island states—Cyprus, Iceland and Malta. Eur J Public Health. 2022;32:316–321. doi: 10.1093/eurpub/ckab217. [DOI] [PMC free article] [PubMed] [Google Scholar]
- Hussain M, Ali M, Ismail M, et al. Management of the first severe case of COVID-19 in the small islands of Maldives. Respir Med Case Rep. 2020;30:101118. doi: 10.1016/j.rmcr.2020.101118. [DOI] [PMC free article] [PubMed] [Google Scholar]
- Calleja N, Gualtieri A, Terzic N, Scoutellas V, Calleja-Agius J. Managing COVID-19 in four small countries: Initial response to the pandemic in San Marino, Montenegro, Malta and Cyprus. Health Policy. 2022;126:281–286. doi: 10.1016/j.healthpol.2022.01.008. [DOI] [PMC free article] [PubMed] [Google Scholar]
- Truc F, Gervino G. The Effects of Physical Distancing and Lockdown to Restrain SARS-Cov-2 Outbreak in the Italian Municipality of Cogne. Archives of Internal Medicine Research. 2021;4:267–80. [Google Scholar]
- McLaughlin CC, Doll MK, Morrison KT, McLaughlin WL, O’Connor T, Sholukh AM, et al. High Community SARS-CoV-2 Antibody Seroprevalence in a Ski Resort Community, Blaine County, Idaho, US. Preliminary Results. medRxiv [Internet] 2020 Jul 21;07(19):20157198. Available from: http://www.ncbi.nlm.nih.gov/pubmed/32743610 (accessed on May 6th, 2022) [Google Scholar]
- Grande E, Fedeli U, Pappagallo M, et al. Variation in Cause-Specific Mortality Rates in Italy during the First Wave of the COVID-19 Pandemic: A Study Based on Nationwide Data. Int J Environ Res Public Health. 2022;19:805. doi: 10.3390/ijerph19020805. [DOI] [PMC free article] [PubMed] [Google Scholar]
- Perico L, Tomasoni S, Peracchi T, et al. COVID-19 and Lombardy: TESTing the impact of the first wave of the pandemic. EBioMedicine. 2020;61:103069. doi: 10.1016/j.ebiom.2020.103069. [DOI] [PMC free article] [PubMed] [Google Scholar]
- Staub K, Panczak R, Matthes KL, et al. Historically High Excess Mortality During the COVID-19 Pandemic in Switzerland, Sweden, and Spain. Ann Intern Med. 2022;175:523–532. doi: 10.7326/M21-3824. [DOI] [PMC free article] [PubMed] [Google Scholar]
- Riccò M, Ranzieri S, Balzarini F, Bragazzi NL, Corradi M. SARS-CoV-2 infection and air pollutants: correlation or causation? Sci Total Environ. 734:139489. doi: 10.1016/j.scitotenv.2020.139489. [DOI] [PMC free article] [PubMed] [Google Scholar]
- Caranci N, di Girolamo C, Bartolini L, et al. General and COVID-19-related mortality by pre-existing chronic conditions and care setting during 2020 in Emilia-Romagna region, Italy. Int J Environ Res Public Health. 2021;18:13224. doi: 10.3390/ijerph182413224. [DOI] [PMC free article] [PubMed] [Google Scholar]
- Dorrucci M, Minelli G, Boros S, et al. A population-based cohort approach to assess excess mortality due to the spread of COVID-19 in Italy, January-May 2020. Ann Ist Super Sanità. 2022;58:25–33. doi: 10.4415/ANN_22_01_04. [DOI] [PubMed] [Google Scholar]
- de Flora S, la Maestra S. Growth and decline of the COVID-19 epidemic wave in Italy from March to June 2020. J Med Virol. 2021;93:1613–9. doi: 10.1002/jmv.26499. [DOI] [PubMed] [Google Scholar]
- Bianco L, Moser M, Silverj A, et al. On the Origin and Propagation of the COVID-19 Outbreak in the Italian Province of Trento, a Tourist Region of Northern Italy. Viruses. 2022;14:580. doi: 10.3390/v14030580. [DOI] [PMC free article] [PubMed] [Google Scholar]
- R Development Core Team. R a language and environment for statistical computing: reference index. R Foundation for Statistical Computing. 2010 Available from: http://www.r-project.org/index.html accessed on May 6th, 2022. [Google Scholar]
- Riccò M. Air temperature exposure and agricultural occupational injuries in the autonomous province of Trento (2000-2013, North-Eastern Italy) Int J Occup Med Environ Health. 2018;31:317–331. doi: 10.13075/ijomeh.1896.01114. [DOI] [PubMed] [Google Scholar]
- Riccò M, Garbarino S, Bragazzi NL. Migrant Workers from the Eastern-Mediterranean Region and Occupational Injuries: A Retrospective Database-Based Analysis from North-Eastern Italy. Int J Environ Res Public Health. 2019;16:673. doi: 10.3390/ijerph16040673. [DOI] [PMC free article] [PubMed] [Google Scholar]
- Zullo F, Marucci A, Fiorini L, Romano B. The Italian Apennines between earthquakes, high naturalness and urban growth. Environ Planning B: Urban Anal City Science. 2020;47:716–31. [Google Scholar]
- Dessie ZG, Zewotir T. Mortality-related risk factors of COVID-19: a systematic review and meta-analysis of 42 studies and 423,117 patients. BMC Infect Dis. 2021;21:855. doi: 10.1186/s12879-021-06536-3. [DOI] [PMC free article] [PubMed] [Google Scholar]
- Wang H, Paulson KR, Pease SA, et al. Estimating excess mortality due to the COVID-19 pandemic: a systematic analysis of COVID-19-related mortality, 2020–21. Lancet. 2022;399:1513–1536. doi: 10.1016/S0140-6736(21)02796-3. [DOI] [PMC free article] [PubMed] [Google Scholar]
- Scortichini M, Schneider Dos Santos R, et al. Excess mortality during the COVID-19 outbreak in Italy: A two-stage interrupted time-series analysis. Int J Epidemiol. 2021;49:1909–17. doi: 10.1093/ije/dyaa169. [DOI] [PMC free article] [PubMed] [Google Scholar]
- Kompaniyets L, Goodman AB, Belay B, et al. Body Mass Index and Risk for COVID-19–Related Hospitalization, Intensive Care Unit Admission, Invasive Mechanical Ventilation, and Death — United States, March–December 2020. MMWR Morb Mortal Wkly Rep. 2021;70:355–361. doi: 10.15585/mmwr.mm7010e4. [DOI] [PMC free article] [PubMed] [Google Scholar]
- Odone A, Delmonte D, Scognamiglio T, Signorelli C. COVID-19 deaths in Lombardy, Italy: data in context. Lancet Public Health. 2020;5:e310. doi: 10.1016/S2468-2667(20)30099-2. [DOI] [PMC free article] [PubMed] [Google Scholar]
- Signorelli C, Odone A, Riccò M, et al. Major sports events and the transmission of sars-cov-2: Analysis of seven case-studies in europe. Acta Biomed. 2020;91:242–4. doi: 10.23750/abm.v91i2.9699. [DOI] [PMC free article] [PubMed] [Google Scholar]
- Emilia Romagna Region. Tourism and Culture - Record-Breaking tourism figures [Internet]. Regione Emilia Romagna - Official Website. 2018 Available from: https://www.regione.emilia-romagna.it/en/tourism-and-culture Accessed on: May 6th, 2022. [Google Scholar]
- Núñez A, Sreeganga SD, Ramaprasad A. Access to healthcare during COVID-19. Int J Environ Res Public Health. 2021;18:2980. doi: 10.3390/ijerph18062980. [DOI] [PMC free article] [PubMed] [Google Scholar]
- Czeisler MÉ, Marynak K, Clarke KEN, et al. Delay or Avoidance of Medical Care Because of COVID-19–Related Concerns — United States, June 2020. MMWR Morb Mortal Wkly Rep. 2020;69:1250–7. doi: 10.15585/mmwr.mm6936a4. [DOI] [PMC free article] [PubMed] [Google Scholar]
- Verelst F, Kuylen E, Beutels P. Indications for healthcare surge capacity in European countries facing an exponential increase in coronavirus disease (COVID-19) cases, March 2020. Euro Surveill. 2020;25:2000323. doi: 10.2807/1560-7917.ES.2020.25.13.2000323. [DOI] [PMC free article] [PubMed] [Google Scholar]
- Flaxman S, Mishra S, Gandy A, et al. Estimating the effects of non-pharmaceutical interventions on COVID-19 in Europe. Nature. 2020;584:257–61. doi: 10.1038/s41586-020-2405-7. [DOI] [PubMed] [Google Scholar]
- European Centre for Disease Prevention and Control (ECDC) Guidelines for the implementation of non-pharmaceutical interventions against COVID-19 Key messages General considerations on NPI to control COVID-19 [Internet]. Stockholm. 2020 Sep [accessed on May 6th, 2022] Available from: https://www.ecdc.europa.eu/sites/default/files/documents/covid-19-guidelines-non-pharmaceutical-interventions-september-2020.pdf . [Google Scholar]
- Morgenstern H. Ecologic Studies In Epidemiology: Concepts, Principles, and Methods. Annu Rev Public Health [Internet] 1995;16:61–2. doi: 10.1146/annurev.pu.16.050195.000425. [DOI] [PubMed] [Google Scholar]
- Roland M, Nolte E. The future shape of primary care. Br J Gen Pract. 2014;64:63–64. doi: 10.3399/bjgp14X676960. [DOI] [PMC free article] [PubMed] [Google Scholar]
- Cohen HW. Limitations of an ecological study: A review. Am J Hypertens. 2005;18:750. doi: 10.1016/j.amjhyper.2005.04.002. [DOI] [PubMed] [Google Scholar]