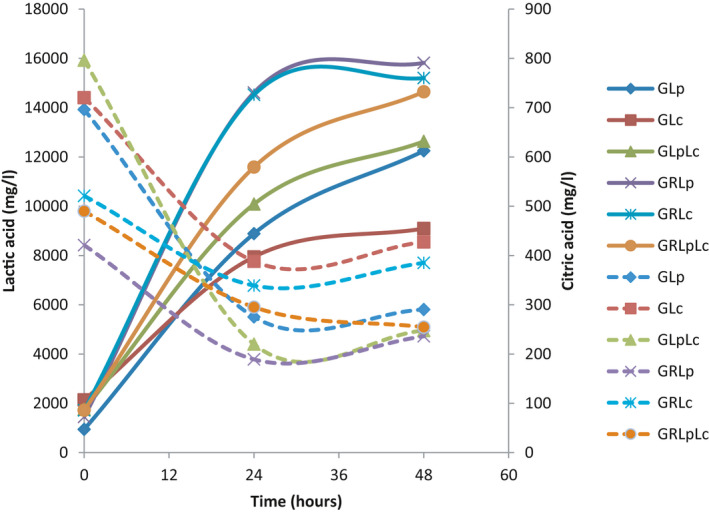
FIGURE 5.

Lactic and citric acid changes during fermentation.. (♦ = fermentation of grape juice) by L. plantarum (GLp),■ = fermentation of grape juice by L. casei (GLc), ▲ = fermentation of grape juice by 1:1 mixture of L. plantarum and L. casei (GLpLc), × = fermentation of 1:1 mixture of grape juice and rice flour solution by L. plantarum (GRLp), * = fermentation of 1:1 mixture of grape juice and rice flour solution by L. casei (GRLc), ● = fermentation of 1:1 mixture of grape juice and rice flour solution by 1:1 mixture of L. plantarum and L. casei (GRLpLc). Dash lines indicate citric acid changes during fermentation
