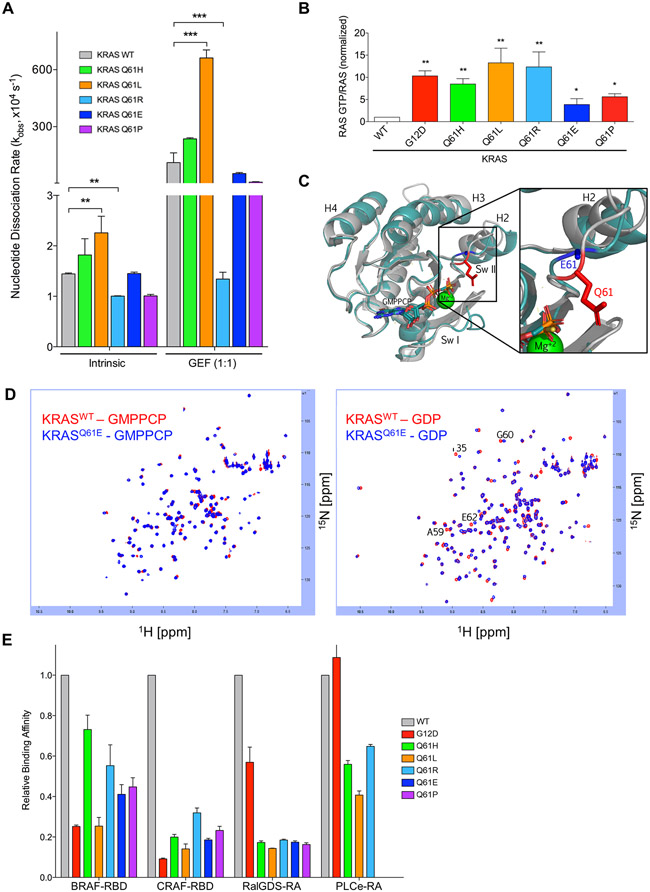
Fig. 2. KRASQ61 proteins show distinct biochemical phenotypes.
(A) Quantification of nucleotide exchange rates of recombinant KRASQ61 mutant proteins (amino acids 2-169) in the absence (left) and in the presence of equimolar concentration of the catalytic domain of RASGRP1. Data are mean ± S.E.M. from three or more independent experiments. ** P ≤ 0.01 and *** P ≤ 0.001 by one-way ANOVA. (B) Quantification of pulldown assay for KRAS-GTP levels in RIE-1 cells using CRAF-RBD shown as mean ± S.E.M. of three independent experiments. * P ≤ 0.05 **, P ≤ 0.01, and *** P ≤ 0.001 by one-way ANOVA. Error bars, (C) Ribbon diagram showing X-ray structural overlays of KRASQ61E (teal, 7LZ5) with KRASWT (silver, 4DSO). Proteins were crystallized bound to non-hydrolyzable GMPPCP. The Q61 sidechain is indicated in red and the E61 sidechain is indicated in blue. (D) KRASQ61E NMR chemical shifts resemble KRASWT. 1H-15N HSQC NMR overlay of KRASWT (red) and KRASQ61E (blue) in the GMPPCP-bound (left) and GDP-bound (right) states. Data are representative of two biological replicates. (E) Relative binding affinities of KRASQ61 proteins to select RAS binding (RBD) and association (RA) domains. Values were normalized to KRASWT for each indicated effector. Data are averages from three or more independent experiments.

