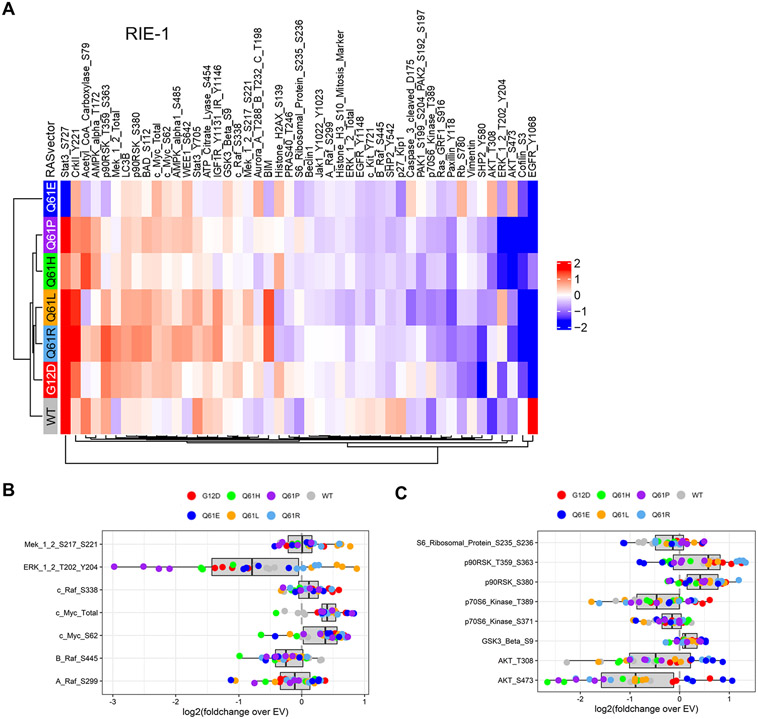
Fig. 3. RIE-1 cells expressing KRASQ61 mutants demonstrate heterogeneous signaling patterns.
(A) Reverse phase protein array (RPPA) pathway activation analysis of RIE-1 cells. Cell lysates were stained with either phospho-specific (site indicated) or total protein antibodies. Heat map represents four biological replicates for each mutant. RPPA data were log2 transformed and medians are presented normalized to EV RIE-1 cells. Phospho- or total protein levels were arranged by hierarchical clustering. Red, increased signal; blue, decreased signal. (B and C) Box plots of ERK MAPK and PI3K-associated signaling changes from RPPA analysis. Shown are individual replicates for indicated KRAS samples normalized to the EV condition.

