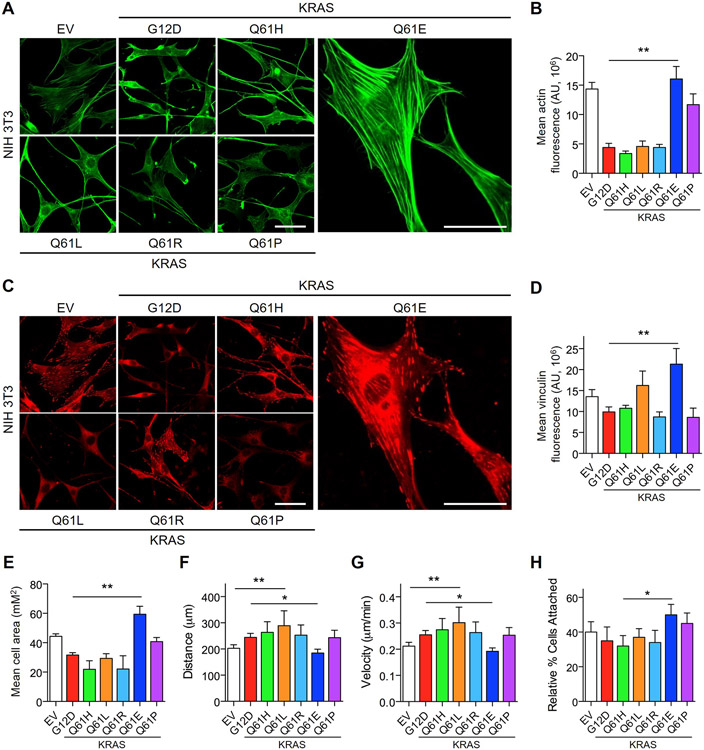
Fig. 5. KRASQ61E induces unique effects on the actin cytoskeleton and cell motility.
(A and B) Representative immunofluorescence images of F-actin stained with phalloidin (A, green) and corresponding quantification of normalized F-actin signal (B) in NIH/3T3 cells ectopically expressing KRASG12D, KRASQ61H or KRASQ61E. Cells were plated on glass coverslips coated with 10 μg/mL fibronectin. Scale bar, 50 μm. Data are representative of >20 cells per condition and quantified as mean ± S.E.M. from three independent experiments. ** P ≤ 0.01 by t-test. (C and D) Representative immunofluorescence images of the focal adhesion marker vinculin (C, in red) and corresponding quantification of normalized vinculin signal (D) of NIH/3T3 cells expressing KRASWT or mutant proteins. Scale bar, 50 μm. Data are representative of > 20 cells per condition and shown as mean ± S.E.M. from three independent experiments. ** P ≤ 0.01 by t-test. (E) Quantification of average cell area of NIH/3T3 cells as in panels (A and C). Data are representative of >20 cells per condition and shown as mean ± S.E.M. from three independent experiments. ** P ≤ 0.01 by t-test. (F and G) Random cell migration patterns showing total distance migrated (F) and average velocity (G) of NIH/3T3 cells expressing KRASWT or mutant proteins. Cells were plated on glass coverslips coated with 10 μg/mL fibronectin and monitored for 16 hours. Data are representative of >10 cells per condition and shown as mean ± S.E.M. from three independent experiments. * P ≤ 0.05 and ** P ≤ 0.01 by t-test. (H) Quantification of adhesion of NIH/3T3 cells to fibronectin-coated dishes. Cells were trypsinized, labeled with CellTracker Green viability dye for 10 min and allowed to rest for 30 min before plating. Percentage attached was normalized to total cells plated. Data shown are mean ± S.E.M. of three independent experiments. * P ≤ 0.05 by t-test.

