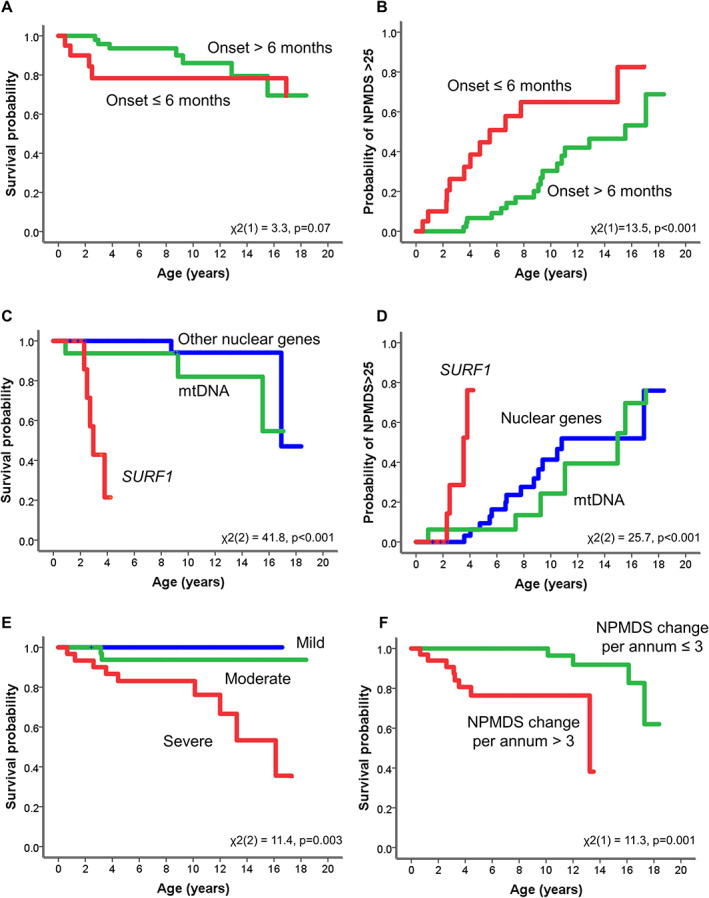
FIGURE 5.

The Kaplan–Meier curves for survival probability from mortality and from severe disease burden (Newcastle Paediatric Mitochondrial Disease Scale [NPMDS] score > 25). (A) Survival probability for those children with disease onset at 6 months and younger. (B) Probability of NPMDS > 25 for disease onset at 6 months and younger. (C, D) Probability of SURF1 cases compared to other nuclear and mitochondrial pathogenic variants from mortality (C) and severe disease burden (NPMDS > 25; D). There were significant differences between the SURF1 cases and the other two genotypes. (E) The survival probability of different disease burden based on NPMDS scores (mild, 0–14; moderate, 15–25; severe, >25). Those children with severe disease burden (NPMDS > 25) had significantly worse survival than those who had mild or moderate disease burden. (F) The survival probability of disease progression shows that those who had a change of >3 points on the NPMDS scores per annum also had significantly poorer survival outcomes. [Color figure can be viewed at www.annalsofneurology.org]
