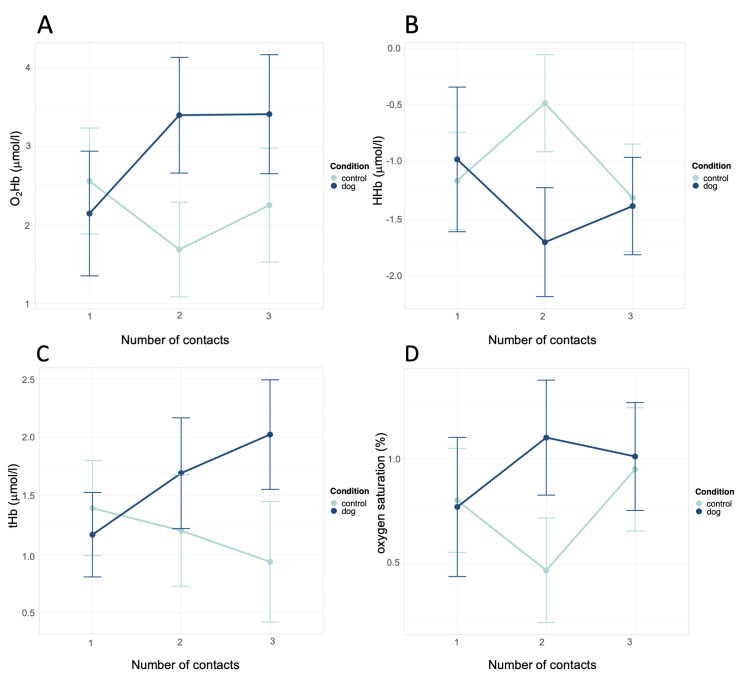
Fig 4. Effects of condition and number of contacts on O2Hb, HHb, tHb, and oxygen saturation.
(A) O2Hb, (B) HHb, (C) tHb, and (D) oxygen saturation. Error bars denote confidence intervals. Data are shown as relative change from phase neutral 1. The data for phase neutral 1 are not included in the presented means.

