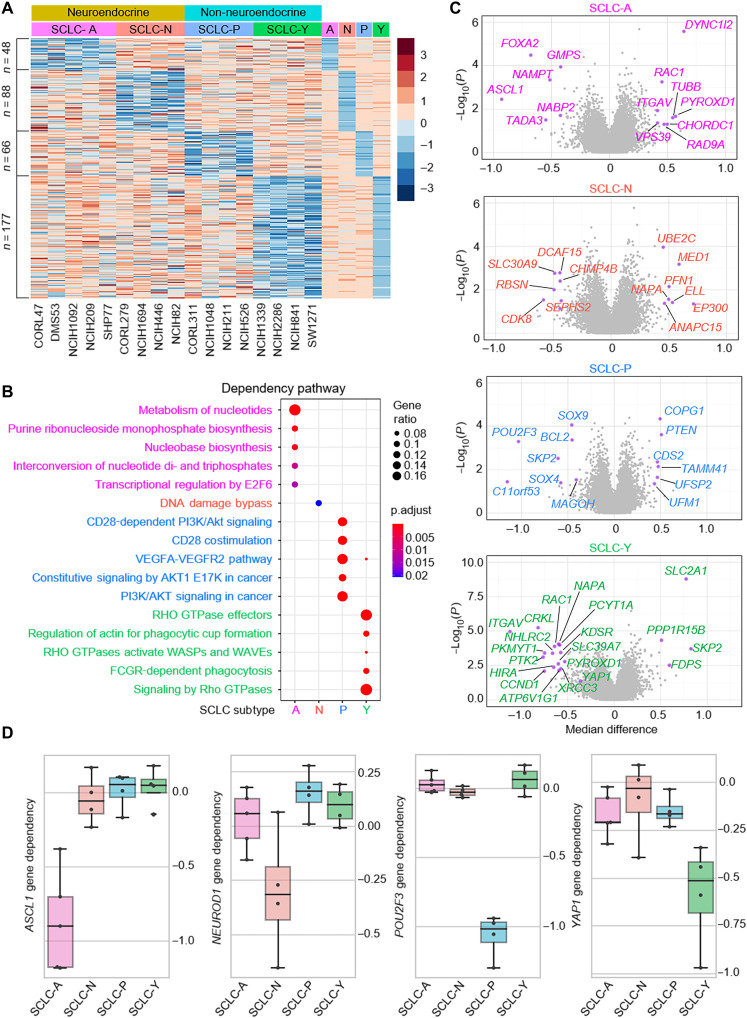
Fig. 1. Landscape of SCLC subtype–specific dependency.
(A) Gene effect scores of all genes were retrieved from DepMap Public 21Q3 datasets for the following 17 SCLC cell lines: A-subtype, CORL47, DMS53, NCI-H1092, NCI-H209, and SHP77; N-subtype, CORL279, NCI-H1694, NCI-H446, and NCI-H82; P-subtype, CORL311, NCI-H1048, NCI-H211, and NCI-H526; Y-subtype, NCI-H1339, NCI-H2286, NCI-H841, and SW1271. A- and N-subtypes were classified as NE and P- and Y-subtypes were classified as non-NE groups. For each subtype, the median gene effect scores of each subtype were calculated, and the z-score heatmap showed genes selectively essential in each group with the criteria that target gene effect score is ≤ −0.5 and the median difference is 0.2 less than the median value of the average of all other groups. (B) Metascape pathway analysis of the essential genes in each subtype as identified above. (C) Volcano plots of the gene essentiality in the four subtypes. X axis is the median difference between the indicated group and others, and y axis is negative log10 P value calculated with t test for the means of two independent samples of scores. Highlighted genes have P < 0.05 and median difference > 0.4 for SCLC-A, SCLC-N, and SCLC-P; P < 0.01, median difference > 0.5 for SCLC-Y subtypes. (D) Box plots showed the ASCL1, NEUROD1, POU2F3, and YAP1 gene dependency in each subtype.

