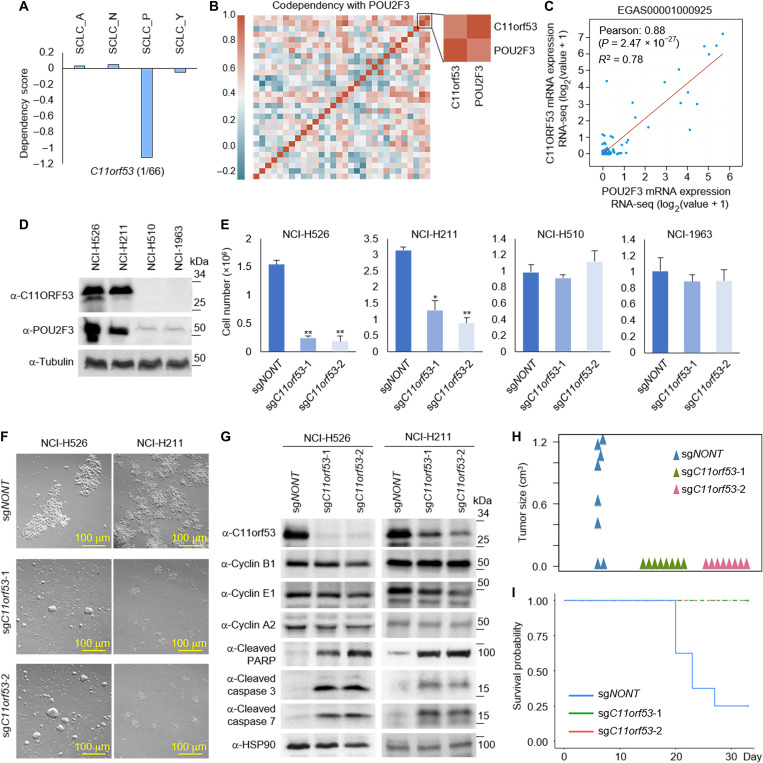
Fig. 2. Identification of C11orf53 as a new marker for SCLC-P subtype.
(A) Box plots showed the C11orf53 gene dependency in each subtype. (B) Codependency matrix showing the Pearson correlation coefficient values of the top 30 genes selectively essential in SCLC-P subtype. (C) The scatter plot shows the correlation between POU2F3 and C11orf53 mRNA levels in 110 patient samples (EGAS00001000925). RNA-seq, RNA-sequencing. (D) The protein levels of C11orf53 were determined by Western blot in four different SCLC cell lines. (E) Four different SCLC cell lines—NCI-H526 (SCLC-P), NCI-H211 (SCLC-P), NCI-H510 (non–SCLC-P), and NCI-H1963 (non–SCLC-P)—were transduced with either nontargeting CRISPR sgRNA or C11orf53-specific sgRNAs for 4 days. The cell viability was determined by cell counting assay, n = 3, two-tailed unpaired Student’s t test. **P < 0.01; *P < 0.05. (F) NCI-H526 and NCI-H211 cell lines were transduced with either nontargeting CRISPR sgRNA or C11orf53-specific sgRNAs for 4 days. The cell morphology was shown under bright field microscopy. (G) The protein levels of C11orf53, cyclin B1, cyclin E1, cyclin A2, cleaved PARP, cleaved caspase 3, and cleaved caspase 7 were determined by Western blot in NCI-H526 and NCI-H211 cell lines with C11orf53 CRISPR depletion. HSP90 was used as an internal control. A total of 1 × 10⁶ of NCI-H526 SCLC cells were transduced with either nontargeting sgRNAs or two distinct C11orf53 sgRNAs that were then inoculated into the right flank of athymic nude mice, n = 8 per group. The tumor growth was measured using a calibrated caliper every 2 to 3 days. Weltch’s t test was used for statistical analysis (H). When each tumor reached 1 cm3, a mouse was euthanized and the survival probability was shown in (I). Log-rank test was performed.

