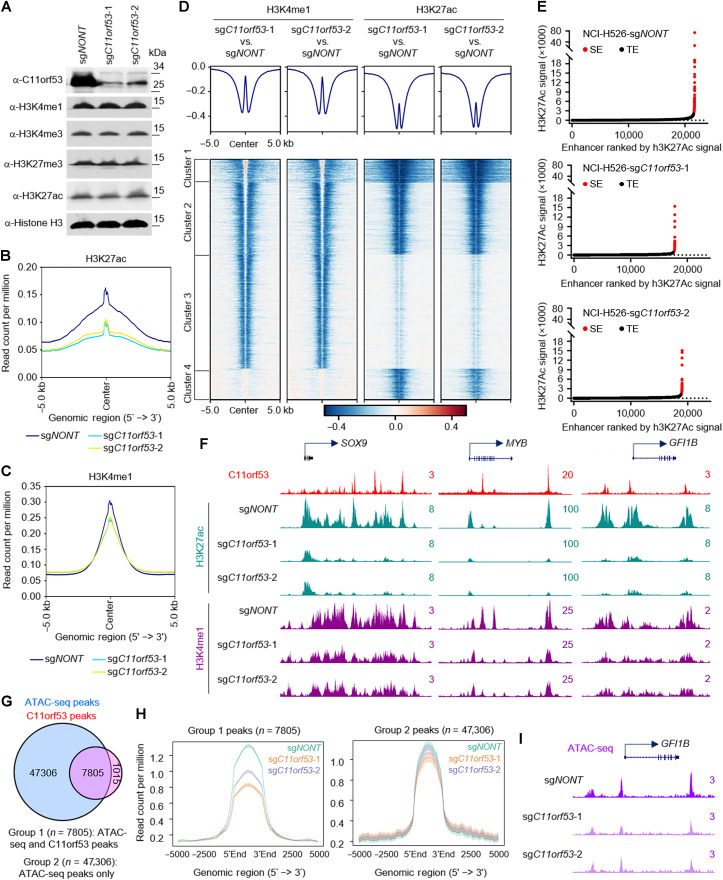
Fig. 4. Loss of C11orf53 reduces enhancer activity and chromatin accessibility.
(A) NCI-H526 cell lines transduced with either nontargeting CRISPR sgRNA or C11orf53-specific sgRNAs for 4 days. The protein levels of C11orf53, H3K4me1, H3K4me3, H3K27me3, and H3K27ac levels were determined by Western blot. Total histone H3 was used as internal control. The average plot shows the total H3K27ac (B), and H3K4me1 (C) peaks in NCI-H526 cell lines transduced with either nontargeting CRISPR sgRNA or C11orf53-specific sgRNAs. Chromatin from Drosophila S2 cells (10%) was used as spike-in. IgG, immunoglubulin G. (D) The log2 fold-change heatmap shows the loss of H3K4me1 and H3K27ac signal at C11ORF53 peaks after C11ORF53 depletion. (E) Histone H3K27ac signals from ChIP-seq identifies putative SEs in NCI-H526 cells transduced with either nontargeting CRISPR sgRNA (top) or two distinct C11orf53-specific sgRNAs (middle and bottom). Hockey-stick plot representing the normalized rank and signals of H3K27ac. Representative of top-ranked SE-associated genes from each group are labeled. aa, amino acids. (F) Representative track examples have shown the H3K27ac levels at SOX9, GFI1B, and PTGS1 gene loci in cells transduced with either CRISPR sgRNA or C11orf53-specific sgRNAs. (G) The Venn diagram shows the overlap between ATAC-seq peaks and C11orf53 peaks in NCI-H526 cells. (H) The average plot shows the ATAC-seq signal between cells transduced with either CRISPR sgRNA or C11orf53-specific sgRNAs. The group 1 peaks are ATAC-seq/C11orf53 common peaks. Group 2 peaks are ATAC-seq alone peaks. (I) Representative tracks showing ATAC-seq peaks at GFI1B gene loci in cells transduced with either CRISPR sgRNA or C11orf53-specific sgRNAs.

