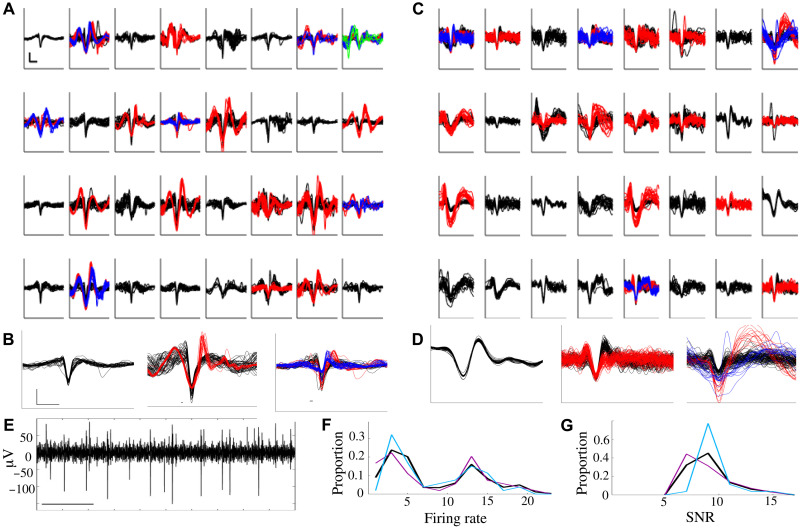
Fig. 7. Recording of action potentials from mouse brain.
(A) Spike waveforms extracted from 32-channel electrode placed in mouse sensorimotor cortex. Scale bar, 1 ms × 100 μV. Individual isolated neurons are shown in different colors (black, 1; red, 2; blue, 3; green, 4). (B) Zoomed-in image of randomly selected waveforms from channels with one, two, or three putative neurons. Scale bar as in (A). (C and D) Waveforms as in (A) and (B), from the second use of a different electrode placed into sensorimotor cortex. Scale as in (A) and (B). (E) Representative trace of neural activity from a single channel. Scale bar, 100 ms. Distribution of (F) average firing rate and (G) SNR of neurons identified in (A) (magenta), (B) (cyan), and across all eight recording sessions (black).

