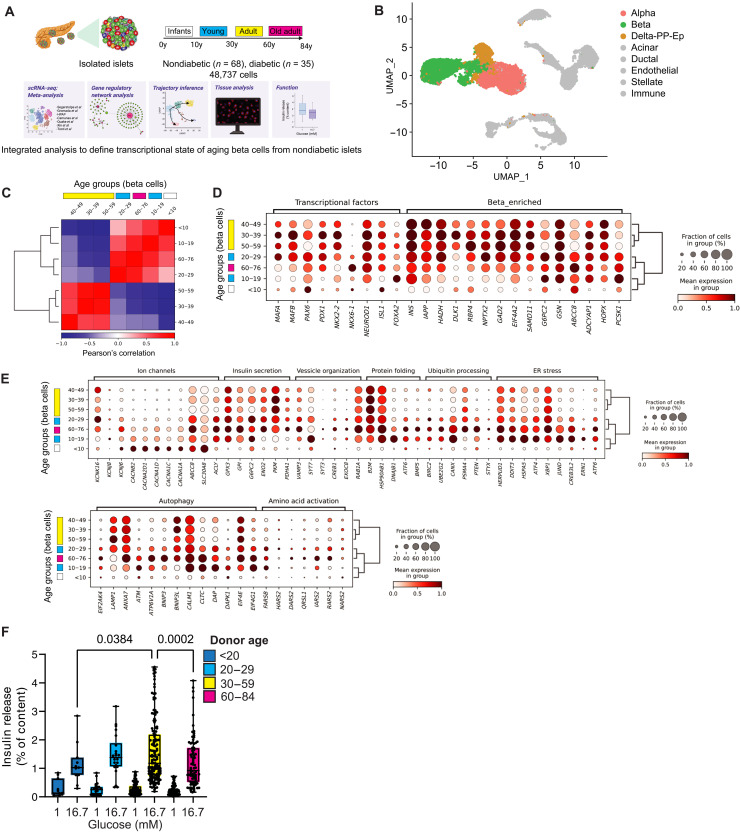
Fig. 1. Gene transcription landscape of aging human beta cells.
(A) Integration of human islet single-cell RNA sequencing (scRNA-seq) and analysis for cell type identity, pseudotime trajectory, TF activity, and GRN analysis. Glucose-stimulated insulin release assays (GSIS) from isolated human islets quantified beta cell function, and confocal microscopy quantified human beta cell TF expression in situ. (B) Uniform Manifold Approximation and Projection (UMAP) of our integrated scRNA-seq dataset with 68 nondiabetic (ND) donors, 35 diseased donors, and 48,737 cells in total. Major islet cell types are shown; non-endocrine cells are in gray. (C) Pearson correlation matrix and hierarchical clustering analysis (HCA) of human beta cell transcriptomes shows high similarity between beta cells from younger (0 to 29 years old) and older (>60 years old) samples, or between middle age samples (30 to 59 years old). (D) Dot plot with HCA of beta cell TFs and beta cell–enriched genes in each decade of life. (E) Dot plot with HCA of beta cell ion channel, insulin secretion, vesicle organization, protein homeostasis, stress, autophagy, and amino acid activation genes. (F) GSIS of isolated islets from 268 ND donors incubated with 1 or 16.7 mM glucose concentrations and split across different age ranges. Data are shown as a fraction of the total beta cell insulin content. Each point represents one individual donor. Statically significant differences were determined by one-way analysis of variance (ANOVA) with Tukey multiple comparisons posttest.

