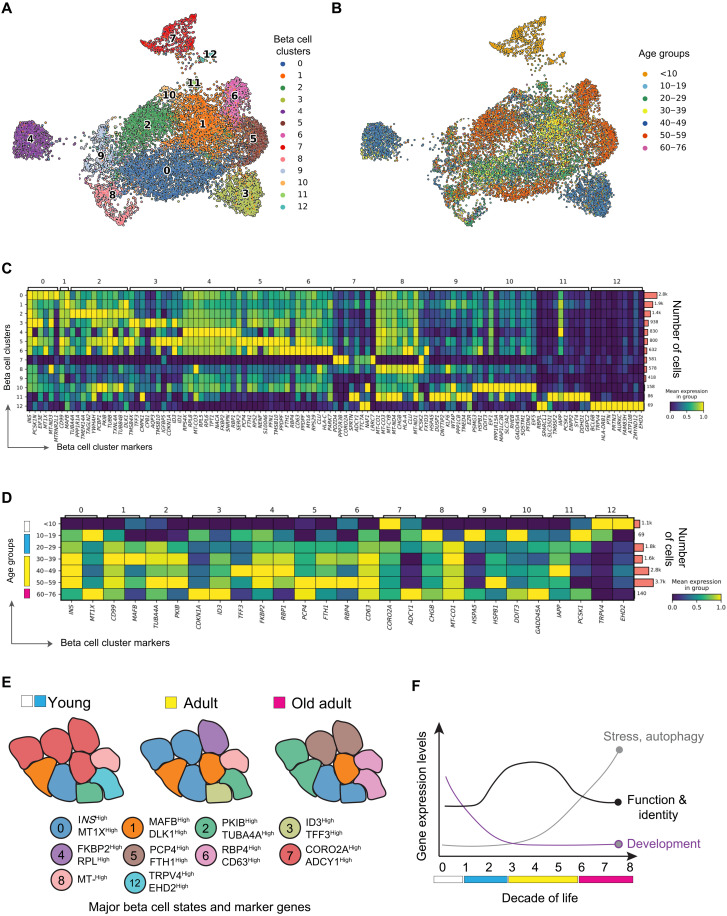
Fig. 3. Effect of aging on the prevalence of distinct beta cell transcriptional states.
(A) UMAP of 11,279 human ND beta cells and transcriptionally different human beta cells. (B) Same as in (A); however, each beta cell is colored by the age decade of their respective donor. (C) Heatmap of differentially expressed genes per cluster. Rows on the left and top columns provide the identity of each beta cell cluster. Bars on the right show the total number of cells in each cluster. (D) Heatmap of differentially expressed genes in different decades of life. Rows on the left indicate decades of age, the top column identifies each beta cell cluster, the bottom column identifies differentially expressed genes found in each cluster, and bars on the right show the total number of cells in each age decade of life. (E) Illustration of changes in beta cell state composition associated with transcriptional heterogeneity phenotypes identified from our clustering approach. (F) Illustration highlighting the effect of aging on the expression dynamics of beta cell development, stress, function, and identity genes. In (A), cell colors match the colors assigned to each beta cell cluster from (A).

