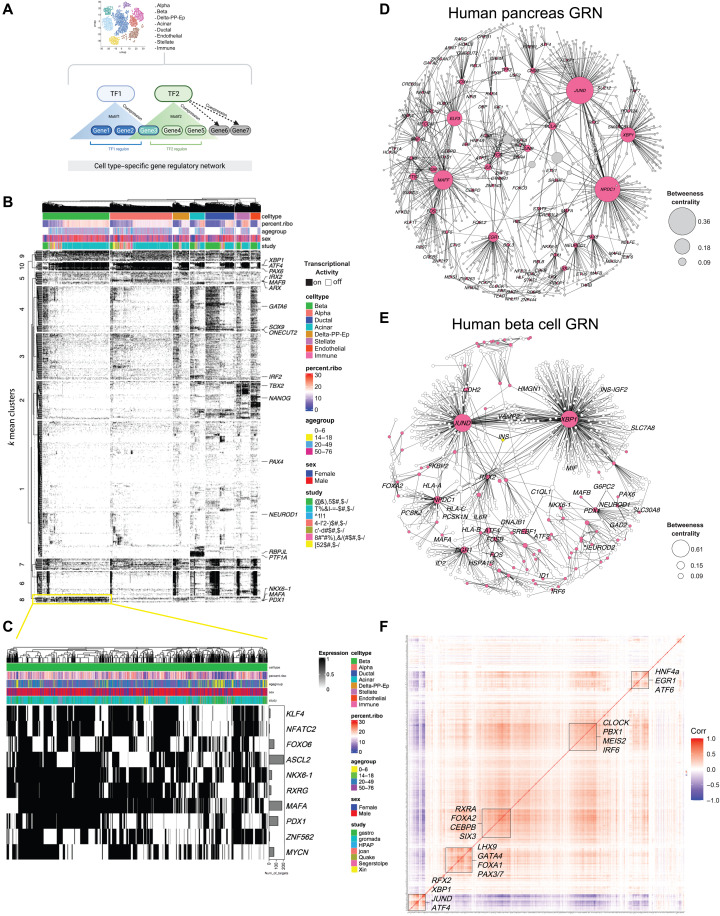
Fig. 4. Identification of beta cell GRNs.
(A) Illustration of SCENIC analysis. (B) Heatmap and hierarchical clustering analysis (HCA) of TF activity patterns. TFs classified as “ON” are shown in black, while TFs classified as “OFF” are in white. Top rows show the distribution of cells within the heatmap subdivided by cell type, age group, percent of ribosomal genes, sex, and study origin. Column dendrogram represents HCA clades within each cell type using “Euclidean” distances. Rows are TFs identified using SCENIC. Beta cell–enriched TFs are in (C). (D and E) GRNs formed by TFs identified using SCENIC in the human pancreas and in beta cells, respectively. TFs are shown as pink nodes, while target protein-coding genes are shown in light gray in (D) and white in (E). Black lines connecting the nodes represent the importance metric (IM) between TF-gene pairs, where thicker edges indicate stronger TF-target relationship. Node size represents the “betweenness centrality” measurements that report on the influence of a given TF within the network. (F) Pearson correlation matrix of 609 human beta cell TFs. Correlation index scale is on the right. Bounding boxes highlight clusters of TFs with high degree of correlation.

