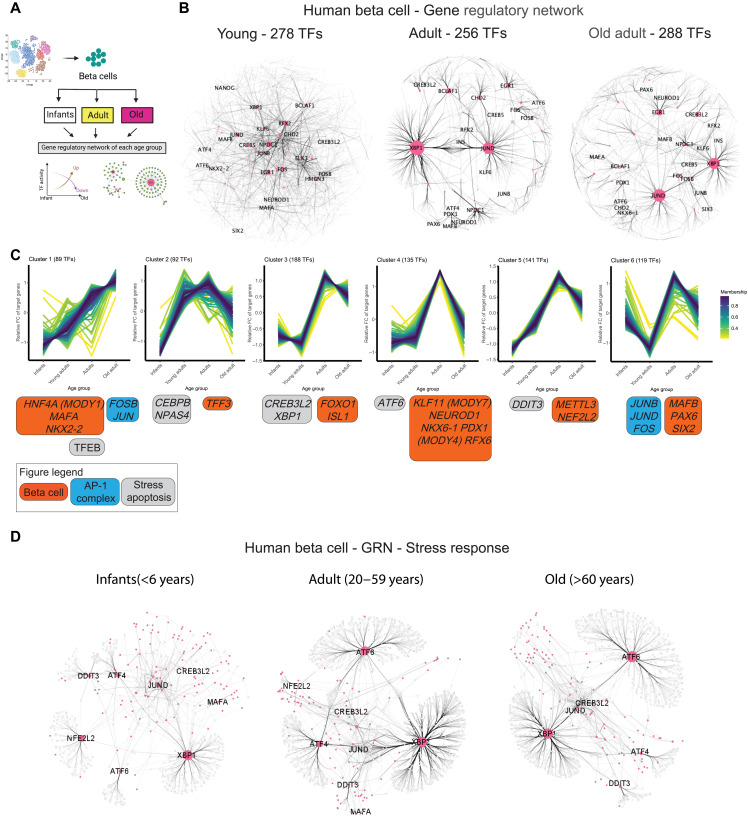
Fig. 5. Changes in the TF-GRN landscape of human beta cells in young, adult, and old adult humans.
(A) Schematics of the approach used to generate age group–specific GRNs. (B) Network graphs illustrating the GRNs formed by TFs identified using SCENIC in human beta cells from young (<6 years old), adult (20 to 59 years old), or old adult (>60 years old) donors. TFs are shown as pink nodes, while target protein-coding genes are shown in light gray. Black lines connecting the nodes represent the IM between TF-gene pairs, with thicker edges indicating stronger relation of TF-target. The size of each node represents the betweenness centrality measurements (often used, as a measure of “hub status” due to its influence in flow of information) of a given TF within the network. (C) Clustering analysis identified by TCseq resulted in six different families of TFs based on the number of targets gained or lost over increasing age. Identity of select TFs belonging to each family is shown at the bottom of each graph. (D) Same as in (B); however, these GRNs are focused on ER stress–related TFs to highlight age-dependent differences in the organization and scope of ER stress GRNs in human beta cells.

