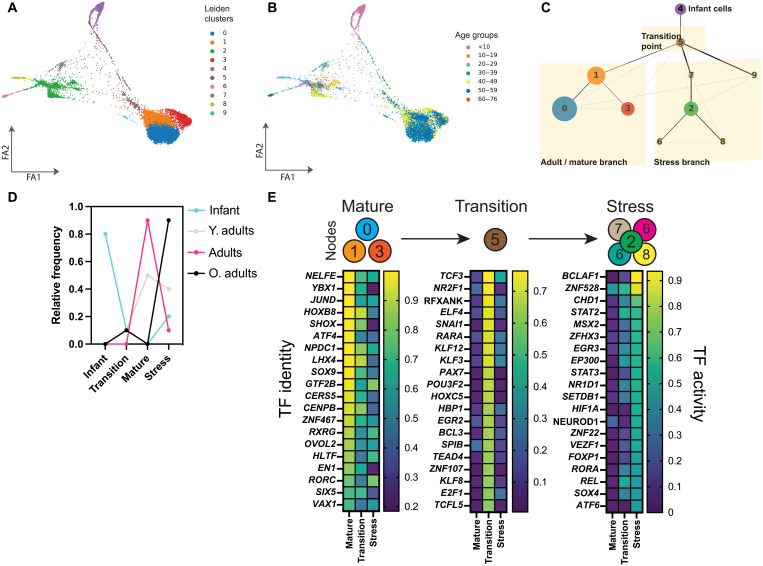
Fig. 6. Pseudotime ordering of human beta cells classified by TF activity at the single-cell level.
(A and B) Force-directed layout to project the Leiden clusters of human beta cells from ND donors analyzed using SCENIC into two dimensions. Distinct Leiden clusters representing distinct beta cell TF states (A) and decades of age for each cell (B) are shown. (C) Trajectory analysis performed with partition-based graph abstraction (PAGA) on SCENIC binary output of ND beta cells’ regulons. Trajectory starts at node number 4 (containing mostly infants), and each following node represents a significant point in the trajectory characterized by a distinct TF signature. (D) Three pseudotime trajectories are shown, namely, transition, mature, and stress, and their respective cell frequency. (E) TF activity identified as differentially modulated across the three different pseudotime trajectories.

