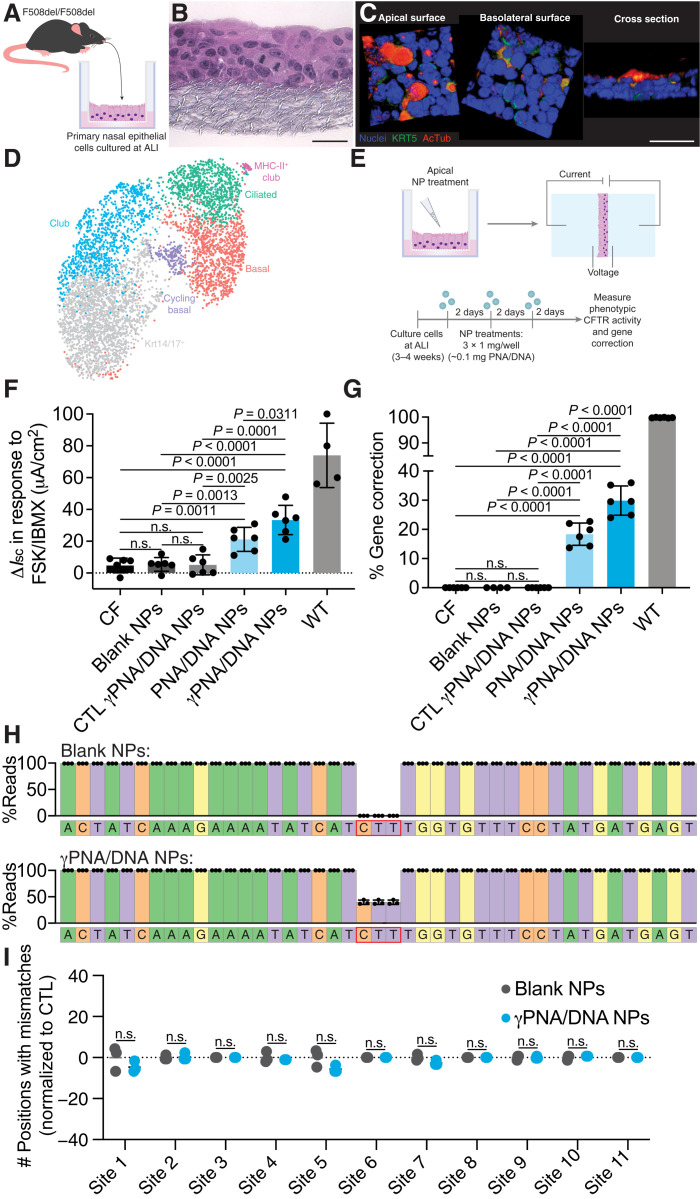
Fig. 2. PNA NP treatment results in phenotypic and genotypic CFTR correction in physiologically relevant primary NEC ALI cultures consisting of multiple cell types.
(A) Schematic of primary NEC isolation. (B) Hematoxylin and eosin–stained paraffin sections of NEC ALI cultures. Scale bar, 50 μm. (C) Three-dimensional renderings of confocal images of NEC cultures indicating a pseudostratified epithelium containing basal cells (Krt5; green) and ciliated cells [acetylated α-tubulin (AcTub); red]. Nuclei are shown in blue. Scale bar, 50 μm. (D) UMAP plot of scRNA-seq data for primary NEC ALI cultures indicating distinct cell types (basal, cycling basal, Krt14/17+, ciliated, club, and MHC-II+ club) (n = 3 cultures). (E) Schematic of NP treatment scheme in primary NEC ALI cultures. Cells were treated with three doses of 1 mg of blank or PNA/DNA PLGA NPs. PNA/DNA NPs contain ~2 μg/0.2 nmol of PNA and ~2 μg/0.1 nmol of DNA per milligram. (F) Phenotypic ΔIsc measurements following treatment of primary NEC ALI cultures with blank, CTL (nonspecific) γPNA/DNA, PNA/DNA, or γPNA/DNA NPs compared to CF or wild-type (WT) controls. (G) ddPCR gene correction assessments of NP-treated primary NEC ALI cultures. (H) Deep sequencing read analysis around the target site of NP-treated primary NEC ALI cultures. (I) Deep sequencing off-target analysis of blank NP– or γPNA/DNA NP–treated NEC ALI cultures at 11 genomic sites, with partial PNA binding site homology displayed as the number of positions with mismatches to the reference sequence normalized to untreated control samples.

