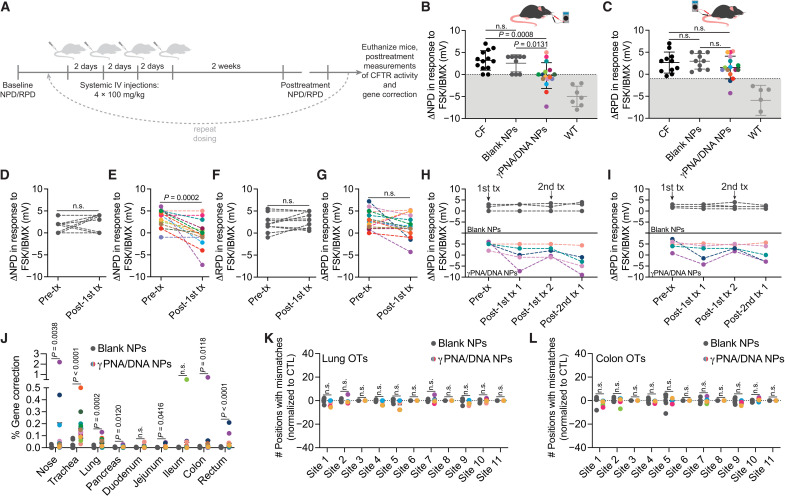
Fig. 3. Functional and genotypic correction of CFTR in vivo following PNA NP administration.
(A) Schematic of in vivo NP dosing scheme. IV, intravenous. (B) Nasal potential difference (NPD) and (C) rectal potential difference (RPD) measurements following either 4 × 2 mg of blank NP (dark gray circles) or 4 × 2 mg of γPNA/DNA NP (multicolored circles) treatment with CF (black circles) and wild-type (light gray circles) controls. Color coding of γPNA/DNA NP–treated animals is consistent throughout this figure, and each color represents a different mouse. γPNA/DNA NPs contain ~2 μg/0.2 nmol of PNA and ~2 μg/0.1 nmol of DNA per milligram; each animal received ~0.2 mg/kg of PNA and donor DNA per dose. Gray region indicates wild-type range. Pre- and posttreatment NPD measurements for F508del-CFTR mice treated with (D) blank NPs and (E) γPNA/DNA NPs. Pre- and posttreatment RPD measurements for F508del-CFTR mice treated with (F) blank NPs and (G) γPNA/DNA NPs. Serial (H) NPD and (I) RPD measurements performed over the course of two treatment rounds for a subset of animals in the γPNA/DNA NP–treated and blank NP–treated cohorts. Arrows indicate treatment round initiation. (J) Gene correction levels measured by ddPCR at the F508del locus for airway and GI organs from mice treated with either blank NPs or γPNA/DNA NPs. Deep sequencing off-target (OT) analysis of blank NP– or γPNA/DNA NP–treated F508del mice (K) lungs and (L) colons at 11 genomic sites, with partial PNA binding site homology displayed as the number of positions with mismatches to the reference sequence normalized to untreated control samples.

