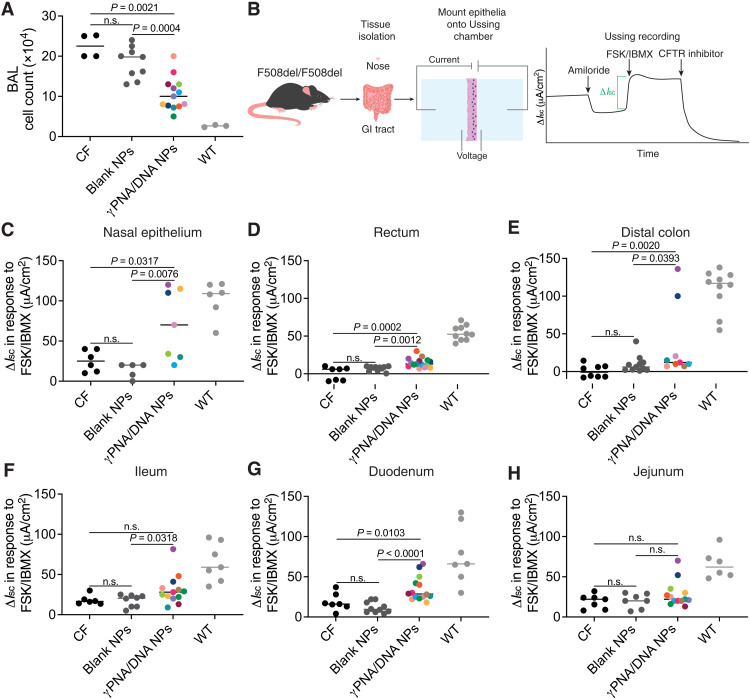
Fig. 4. Functional correction of CFTR ex vivo following PNA NP administration.
(A) BAL cell counts following either blank NP (dark gray circles) or γPNA/DNA NP (multicolored circles) treatment with CF (black circles) and wild-type (light gray circles) controls. Color coding of γPNA/DNA NP–treated animals is consistent throughout this figure, and each color represents a different mouse. γPNA/DNA NPs contain ~2 μg/0.2 nmol of PNA and ~2 μg/0.1 nmol of DNA per milligram; each animal received ~0.2 mg/kg of PNA and donor DNA per dose. (B) Schematic of ex vivo tissue isolation and Ussing chamber assay. Phenotypic ΔIsc measurements in (C) nasal epithelium, (D) rectum, (E) distal colon, (F) ileum, (G) duodenum, and (H) jejunum following either 4 × 2 mg of blank NP (dark gray circles) or 4 × 2 mg of γPNA/DNA NP (multicolored circles) treatment with CF (black circles) and wild-type (light gray circles) controls.

