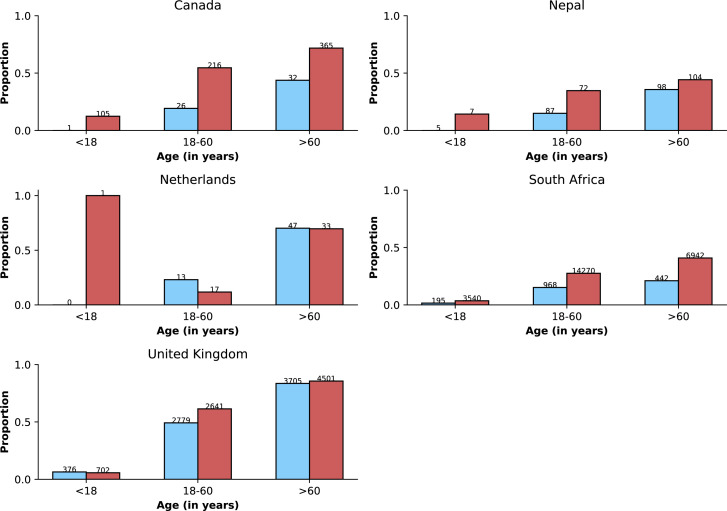
Appendix 1—figure 3. Frequency of previous vaccination by study period, age category and country.
Only data from countries with at least 50 observations with information on previous vaccination during both study periods defined by Omicron variant frequency are shown. In each panel, the x-axis shows different age categories, with blue bars corresponding to the pre-Omicron period and red bars, to the period after Omicron variant frequency, relative to other variants, reaches 90%. Above each bar, the total number of records included in the calculation of the proportions (y-axes) are presented.

