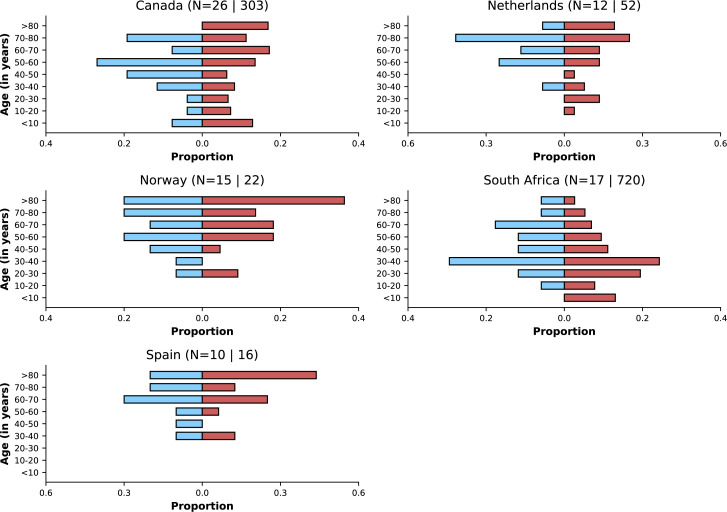
Appendix 1—figure 7. This figure shows similar information to that presented in Figure 3.
The legend of that figure applies to this figure, except that instead of referring to time periods, the figure shows data for Delta and Omicron variants. Only countries with at least 10 observations for Delta and Omicron variants are included.

