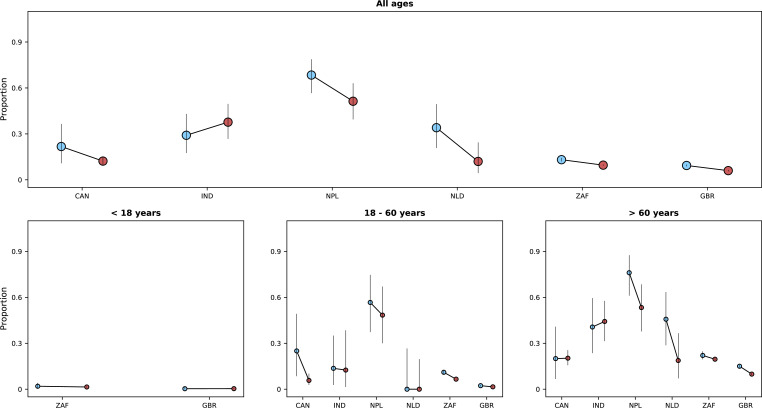
Figure 5. Risk of death (y-axes) in the first 14 days after hospital admission or disease onset, whichever occurred latest, during the pre-Omicron and Omicron periods.
In each panel, the x-axis shows countries (ISO3 codes are presented), with different periods represented by circles with different colours (blue circles for the pre-Omicron period; red circles, for the Omicron period). 95% confidence intervals are also presented. The top panel shows data for individuals of all ages; the bottom panels, data for patients aged less than 18 years, between 18 and 60 years, and older than 60 years. Only countries with at least 50 observations in both study periods are included in the figure; for panels presenting age-specific estimates (bottom row), a further requirement for inclusion was outcome data for at least 10 patients in the corresponding age range in both periods.

