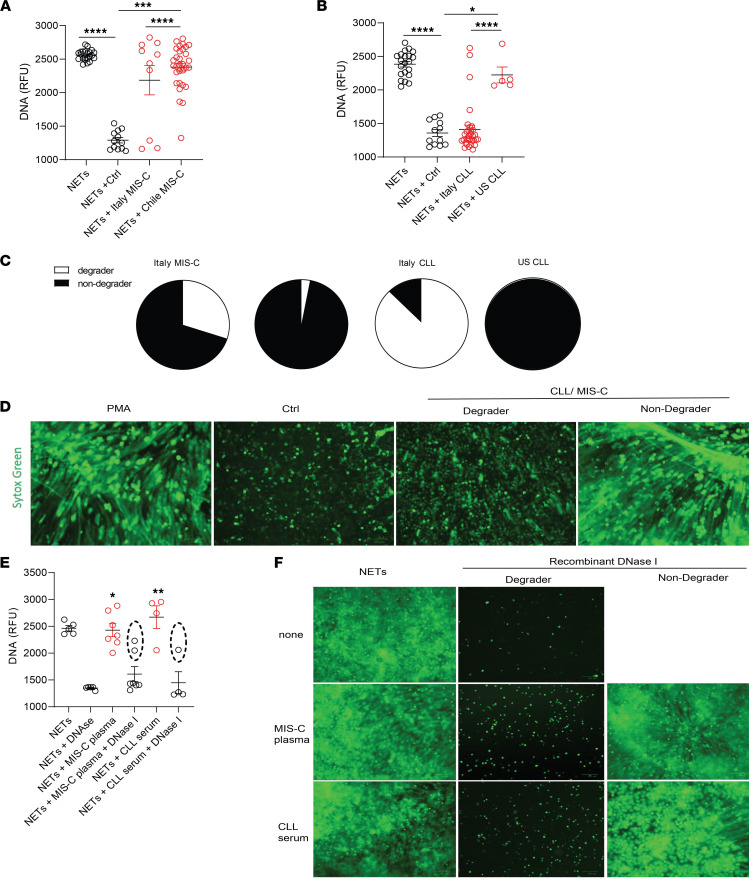
Figure 2. Impaired NET degradation in MIS-C and CLLs.
NET degradation capabilities were measured in MIS-C serum or plasma obtained from (A) Italy (MIS-C n = 12, control n = 12) and Chile (MIS-C n = 27) and CLLs obtained from (B) Italy (CLL n = 27, control n = 12) and the United States (n = 5). Results are the mean ± SEM. Kruskal-Wallis analysis was performed. (C) Pie charts representing the proportion of degrader (white) and nondegrader (black) per cohort. (D) Representative images of PMA-generated NETs by healthy control neutrophils incubated with serum or plasma from pediatric controls or patients with MIS-C or CLLs. DNA is detected by SYTOX green and scale bar is 100 μm. (E) NET degradation capabilities were measured in serum or plasma of MIS-C (n = 7) and CLL (n = 4) samples in the presence or absence of recombinant DNase1. Samples within dashed ovals are those that did not respond to treatment with DNase1. Kruskal-Wallis analysis was performed. (F) Representative images of PMA-generated NETs incubated with serum or plasma from patients with MIS-C or CLLs in the presence or absence of recombinant DNase1. DNA is detected by SYTOX green and scale bar is 100 μm; *P < 0.05, **P < 0.01, ***P < 0.001, ****P < 0.0001. RFU, relative fluorescence units.

