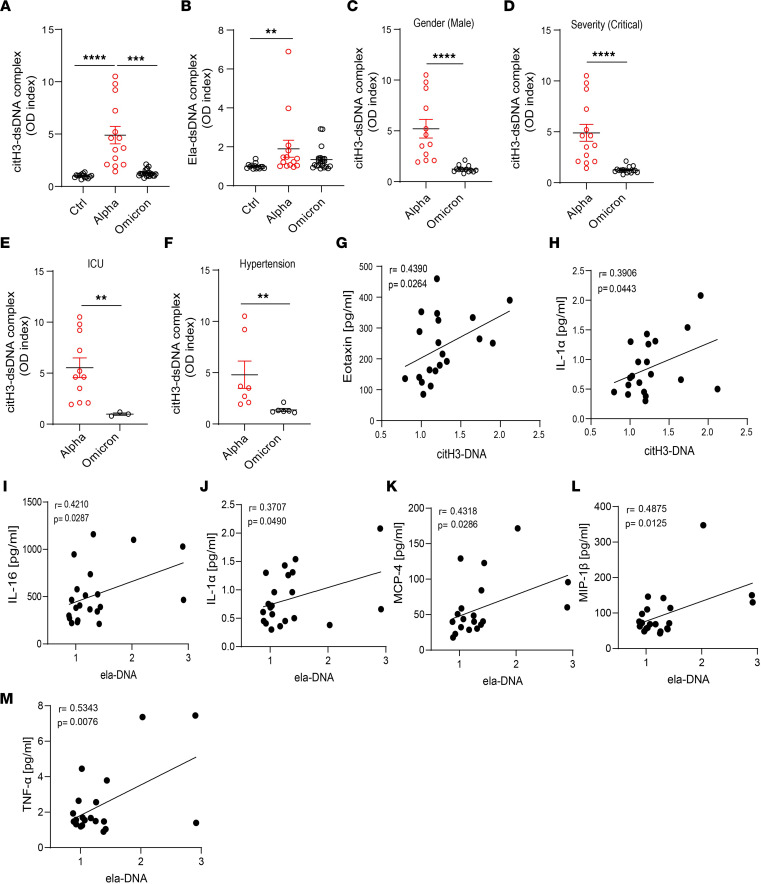
Figure 8. NET remnants are lower in adult unvaccinated patients infected with the Omicron variant.
Plasma levels of (A) citH3- and (B) Ela-dsDNA complexes were measured in Italian COVID-19 patients infected with SARS-CoV-2 Alpha or Omicron variants (ctrl n = 14, Alpha n = 14, Omicron n = 21). Kruskal-Wallis analysis was used. (C) Men infected with the Alpha variant of SARS-CoV-2 displayed elevated levels of citH3-DNA complexes (Alpha, n = 12, Omicron, n = 13). Patients infected with the Omicron variant and with critical severity had (D) lower levels of NETs as assessed by decreased levels of plasma citH3-DNA complexes (Alpha n = 14, Omicron n = 16). (E) Patients with COVID-19 in the ICU displayed decreased levels of citH3-DNA complexes when infected with the Omicron variant (Alpha, n = 11, Omicron n = 3). (F) COVID-19 patients with concomitant hypertension displayed decreased levels of citH3-DNA complexes when infected with the Omicron variant (Alpha n = 7, Omicron n = 6), Mann-Whitney was used. Results are the mean ± SEM. **P < 0.01, ***P < 0.001, ****P < 0.0001. Correlation analysis of citH3-DNA complexes with levels of (G) eotaxin or (H) IL-1α. Correlation analysis of Ela-DNA complexes with levels of (I) IL-16, (J) IL-1α, (K) MCP-4, (L) MIP-1β, or (M) TNF-α. Pearson analysis was used. OD, optical density; Ctrl, controls.

