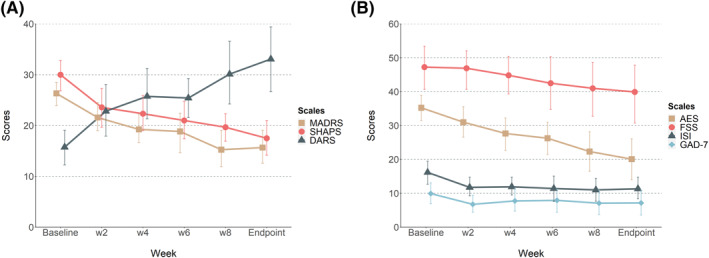
FIGURE 1.

Changes in rating scales scores (A) Change in MADRS, SHAPS and DARS scores over treatment (all p<0.01, related‐samples Wilcoxon signed‐ranks test comparing baseline and week 10). (B) Change in AES, FSS, ISI and GAD‐7 scores over treatment. The change from baseline to week 10 in AES was significant (p<0.01) but not the changes in ISI (p=0.054), FSS (p=0.11) or GAD‐7 (p=0.213). Error bars represents 95% CI.
