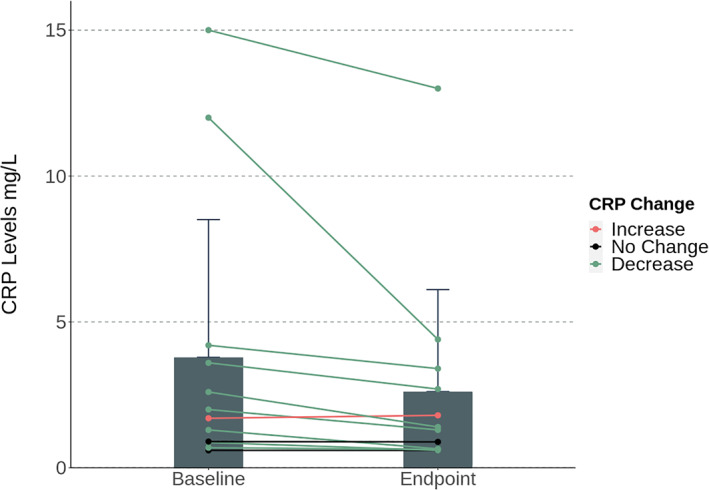
FIGURE 2.

Bar graph and individual trend lines of the mean levels of hs‐CRP (mg/L) at baseline versus endpoint (week 10). The mean levels decreased during the study period from mean 3.8 mg/L at baseline to 2.6 mg/L at endpoint. A related‐samples Wilcoxon signed‐ranks test indicated that this difference was statistically significant (p<0.01). Error bars represents ±SEM.
