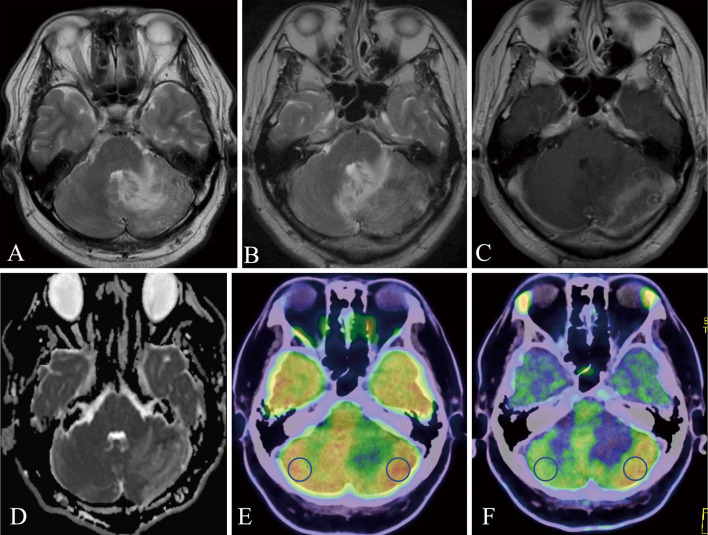
Fig. 1.
Magnetic resonance and positron emission tomography images.
A: T2-weighted image. A high signal was observed in the left cerebellar hemisphere. B: One month after the first T2-weighted image. A high signal was expanded over time. C: Gd-enhanced T1-weighted image of the same period as B. Contrast effects are observed on the surface of the left cerebellar hemisphere. D: Apparent diffusion coefficient map showed a high signal, suggesting the finding of vasogenic cerebral edema. E: Fluorodeoxyglucose (FDG) positron emission tomography (PET) image. Mildly increased FDG uptake on the outside of the left cerebellar hemisphere, consistent with lesions imaged with gadolinium-enhanced magnetic resonance imaging (Gd-MRI). Region of interest was measured at the blue circles. F: Methionine-PET image. Increased methionine uptake on the outside of the left cerebellar hemisphere, consistent with lesions imaged with Gd-MRI. Region of interest (ROI) was measured at the blue circles.

