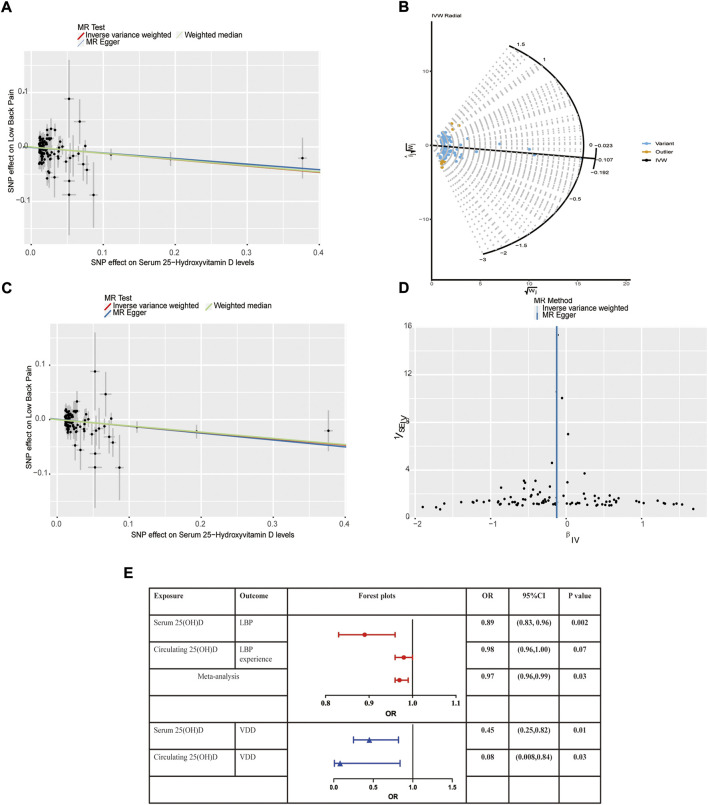
FIGURE 1.
Mendelian randomization estimates from 25(OH)D on low back pain. (A) Scatter plot showing the causality of serum 25(OH)D on low back pain previous to removing outliers identified by MR-PRESSO and MR Radial; (B) Outliers identified by MR Radial; (C) Scatter plot showing the causality of serum 25(OH)D on low back pain after removing outliers identified by MR-PRESSO and MR Radial. (D) Funnel plots; (E) Forest plots of the IVW estimates.

