Figure 6.

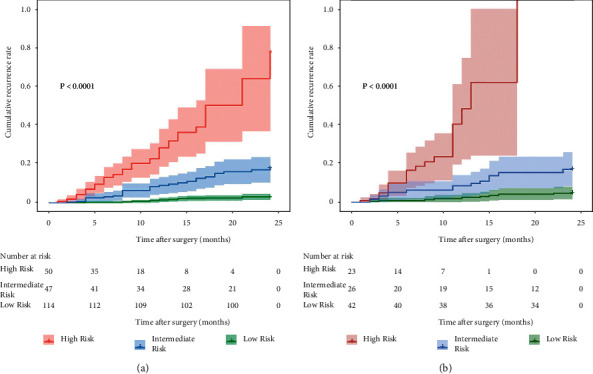
Graphs represent the rates of early recurrence of HCC based on the three risk groups defined by the predictive model in the training and validation datasets.

Graphs represent the rates of early recurrence of HCC based on the three risk groups defined by the predictive model in the training and validation datasets.