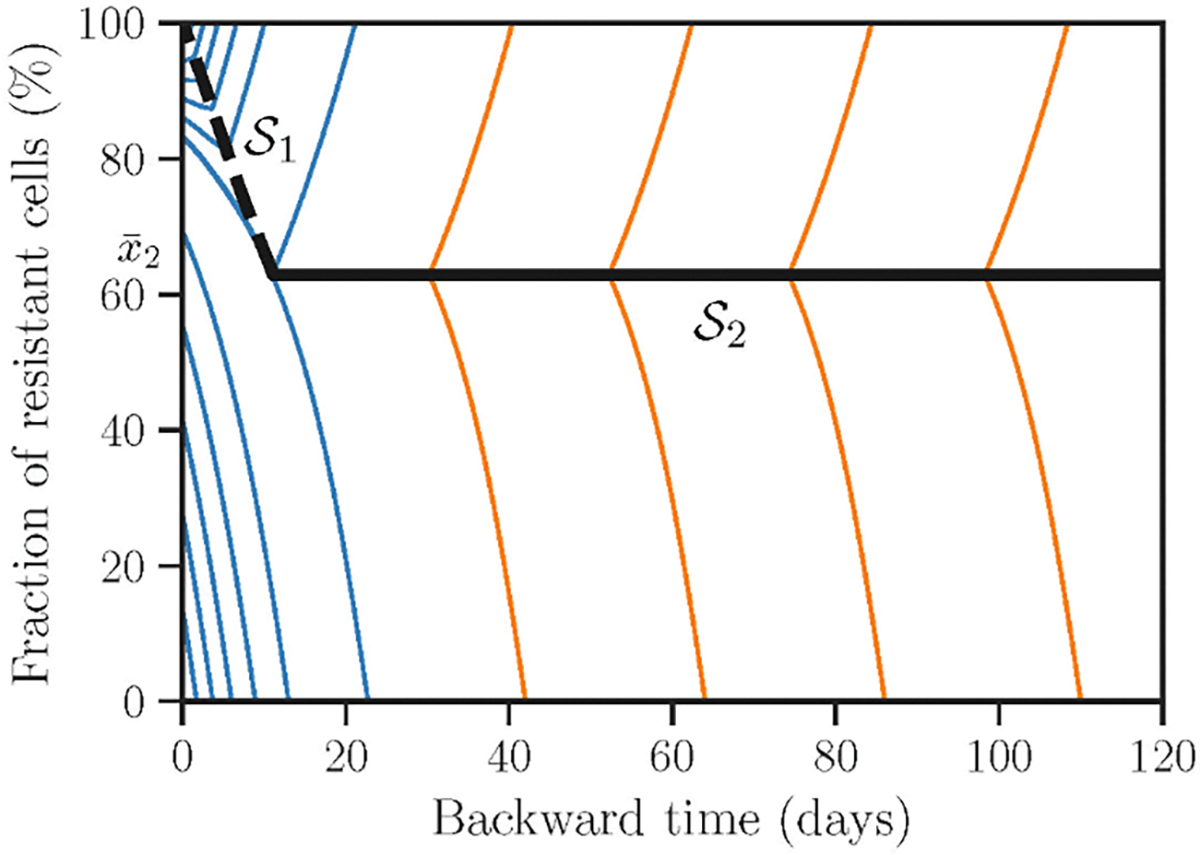
Fig 3: Pattern of optimal trajectories characterized by a switching curve (black dashed) and a singular trajectory (black solid).

Primary field of optimal trajectories is shown in blue. Whereas, the rest of the field of optimal trajectories is shown in orange and was constructed by using the conditions on . The threshold distinguishes optimal trajectories with and without a switch on . Baseline model parameters are as in Table 1.
