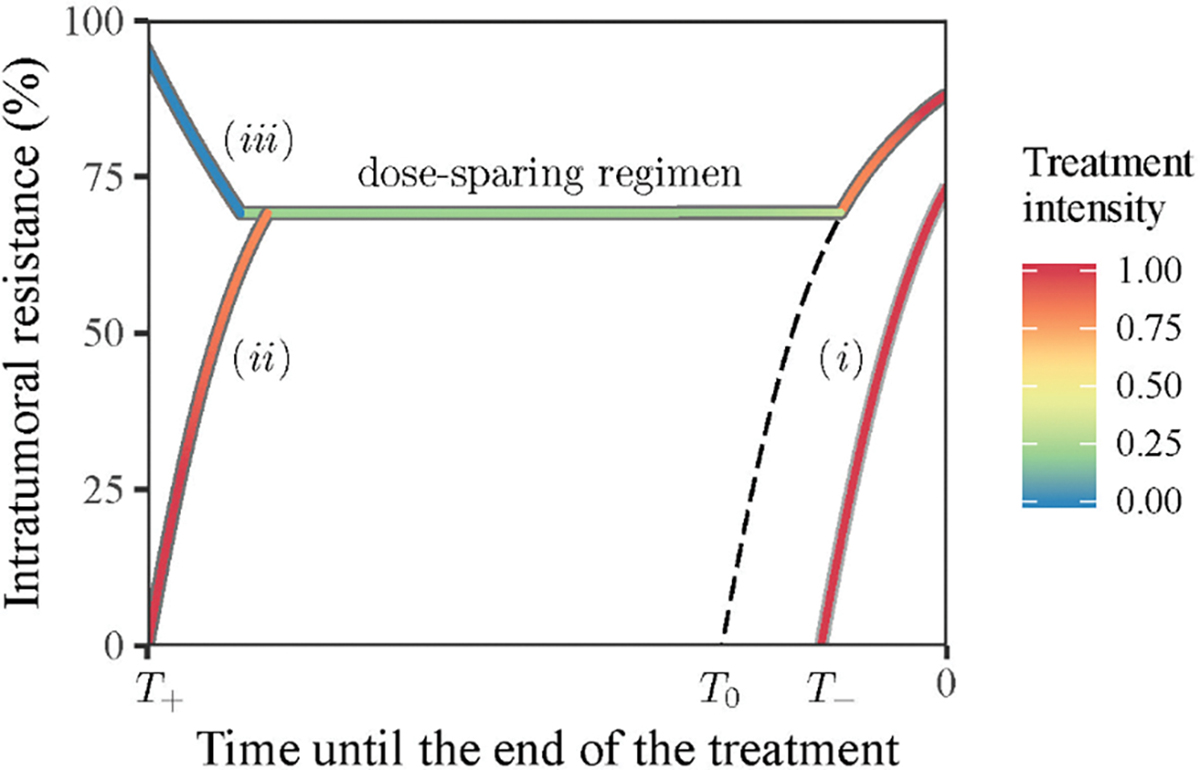
Fig 6: Optimal treatment intensity is determined by the current level of resistance and the total time span of treatment.

The temporal axis marks the direction from the start of a treatment (a positive number) to the terminal point of treatment. The threshold value 𝑇0 separates the trajectories with and without a dose-sparing regimen whose trajectory is marked by the dashed line. Trajectories of three regimens are illustrated (see description in the text). Trajectory colours indicate the applied treatment intensity (legend).
