
Fig 7: Comparison of three different treatment schedules in terms of fold-change in tumour size (A) and dynamics of intratumoral resistance (B).
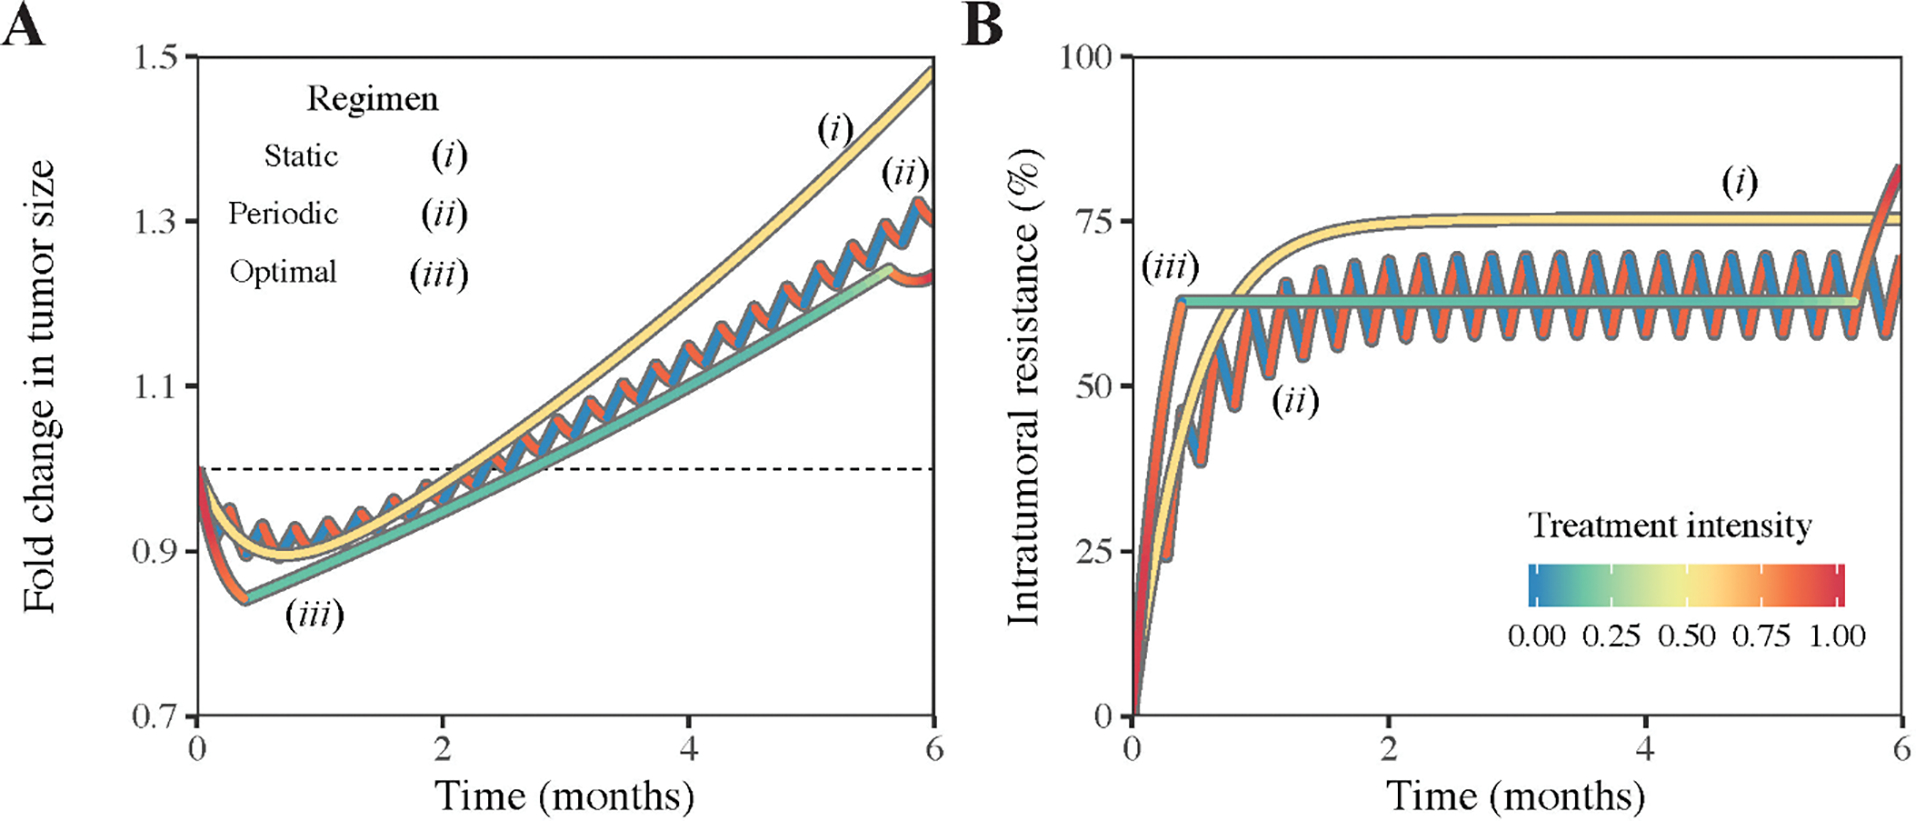
The dashed horizon indicates the fold-change equal to one. Line colours indicate the applied treatment intensity.