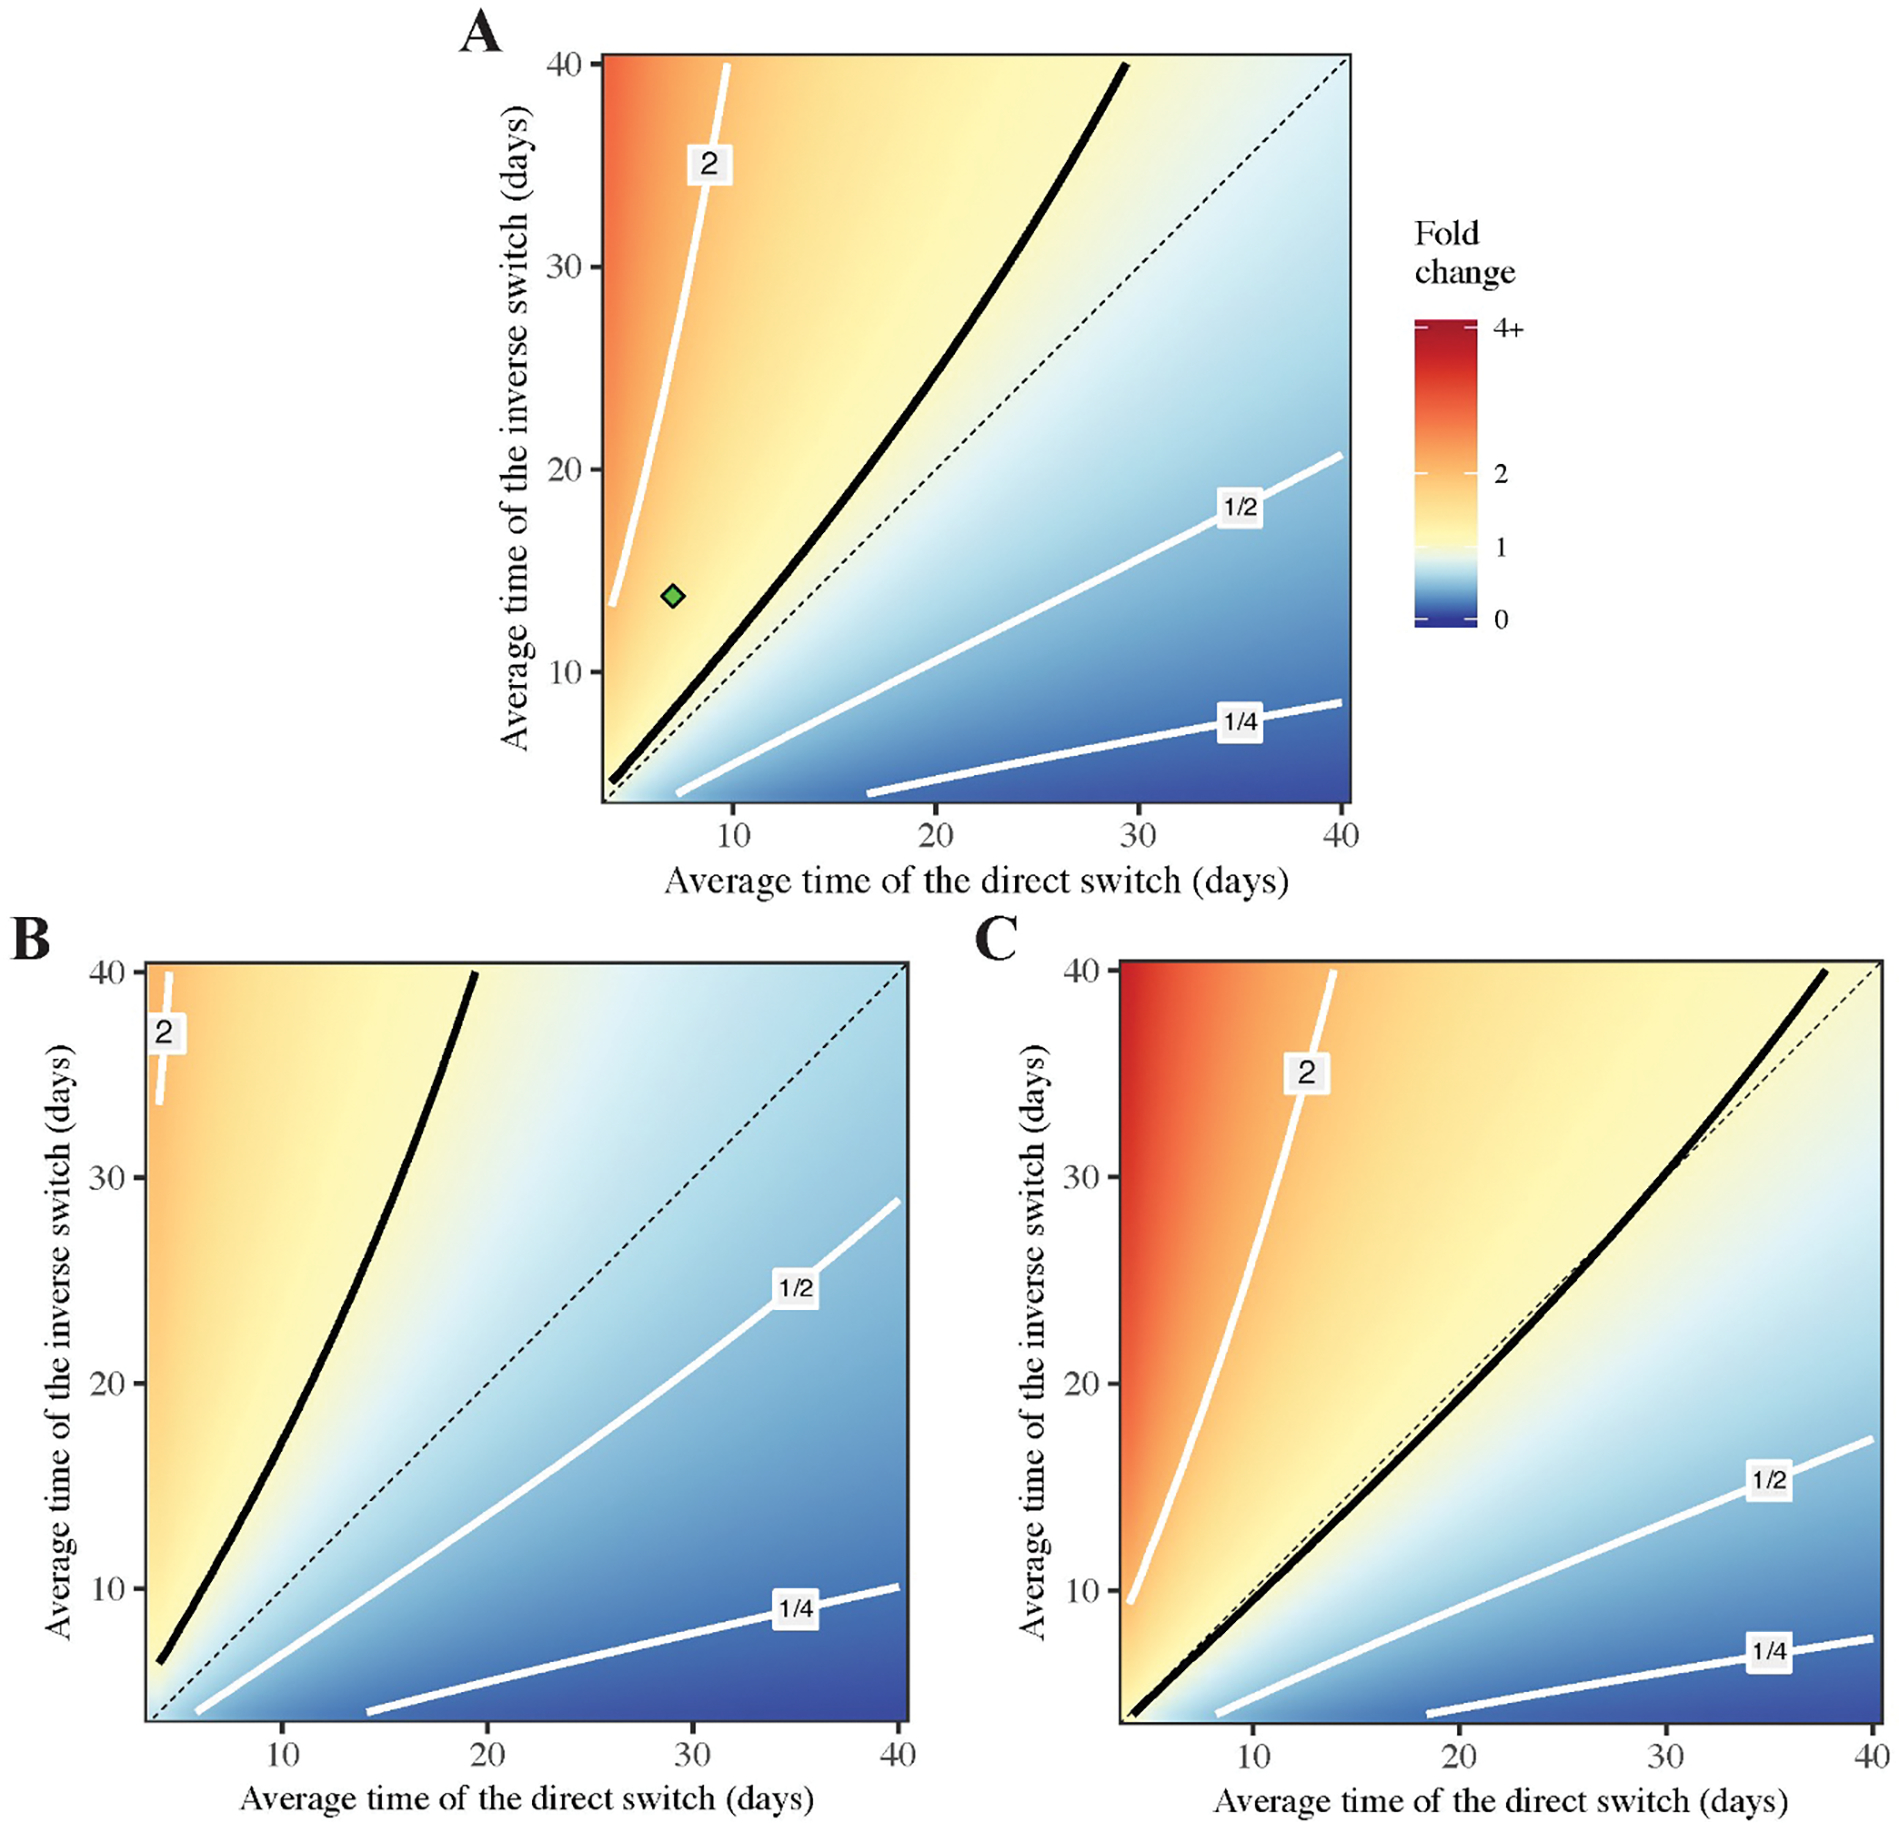
Fig 8: Sensitivity of tumour size after six months of optimally designed treatment.

The varied parameters are characteristic switching times 1/μ and (horizontal and vertical axis respectively). Three panels refer to different values of relative resistance cost: 10% (baseline, A), 5% (B), 40% (C). Other parameters are fixed according to Table 1. The contour line for the fold change equal to one is indicated by solid black, three other contours are shown in grey and correspond to the fold change in the panel to each line. Diagonal for is shown in dashed black. The location of the baseline parameters is indicated by the green point in A.
