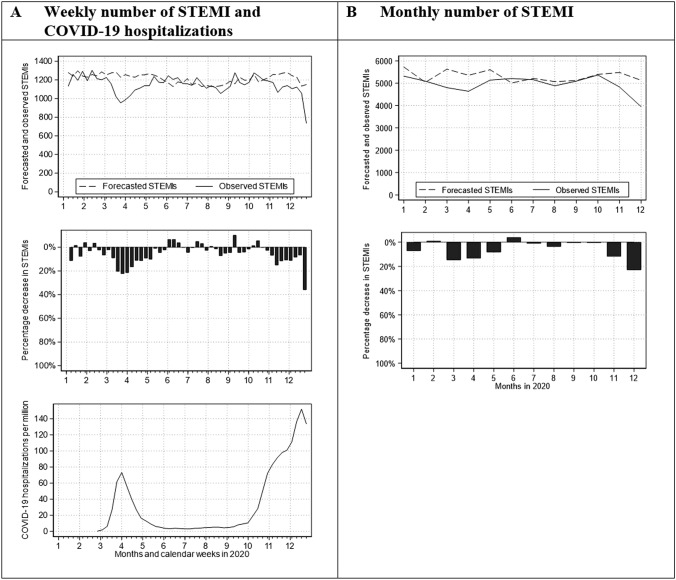
Fig. 1.
Weekly and monthly number of STEMI as well as weekly number of COVID-19 hospitalizations in Germany. Forecasted and observed weekly and monthly number of STEMI interventions (above figures in A and B), relative difference between forecasted and observed weekly and monthly number of STEMI interventions (middle figures in A and B) as well as weekly number of new hospital admissions for COVID-19 per million inhabitants according to Roser et al. [27] (bottom figure in A)

