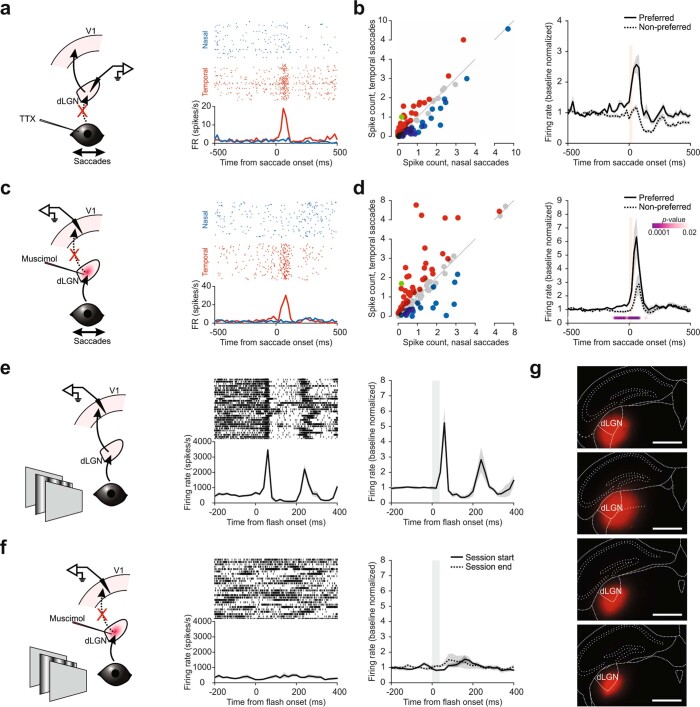
Extended Data Fig. 5. The dLGN is not the source of non-visual saccade input to V1.
a, Left, schematic of dLGN recording during saccades in TTX-blinded animals. Right, example neuron preferring temporal saccades. Raster plots (top) and PETH (bottom). b, Left, scatter plot of the response to nasal and temporal saccades (average spike count in a 100 ms window from saccade onset) for all responsive dLGN neurons (n = 108, 4 mice). Blue, prefer nasal saccades; red, prefer temporal saccades; gray, no statistical difference; green, example neuron in (a). Right, average PETH for preferred and non-preferred saccade directions (n = 77 neurons, 4 mice). Baseline normalized. Shaded area, average ± s.e.m. Vertical orange bar, 0–90% rise time of saccades (26 ms). c, Left, schematic of V1 recording during saccades under dLGN silencing. Right, example neuron preferring temporal saccades. Raster plots (top) and PETH (bottom). d, Left, scatter plot of the response to nasal and temporal saccades (average spike count in a 100 ms window from saccade onset) for all responsive V1 neurons (n = 125, 4 mice). Blue, prefer nasal saccades; red, prefer temporal saccades; gray, no statistical difference; green, example neuron in (c). Right, average PETH for preferred and non-preferred saccade directions (n = 64 neurons, 4 mice). Shaded area, average ± s.e.m. Vertical orange bar, 0–90% rise time of saccades (26 ms). P-values, comparison of activity for preferred and non-preferred saccade directions in 20-ms bins (see Methods). Note the persistence of directionally selective saccade responses in V1 despite dLGN silencing. e, Left, schematic of V1 recording during a brief (32 ms) presentation of a full-field grating (see Methods). Center, multi-unit response from an example recording. Raster plot (top) and PETH (bottom). Right, average PETH of 3 mice. Baseline normalized. Shaded area, average ± s.e.m. 173.5 ± 29% average increase in evoked FR ± s.e.m. f, Left and center, same as in (a), but for mice injected with muscimol-BODIPY in the dLGN. Right, average PETH of 4 mice. Recording started after muscimol injection. Response was measured both at the start of the recording session and at the end. Note the lack of visual response in both cases. Baseline normalized. Shaded area, average ± s.e.m. Average increase in evoked FR ± s.e.m. was −16.7 ± 7.5% (start) and 14.1 ± 8.8% (end). g, Section images of the four mice injected with muscimol-BODIPY in the dLGN in (b). Red, BODIPY. Scale bar, 1 mm.

