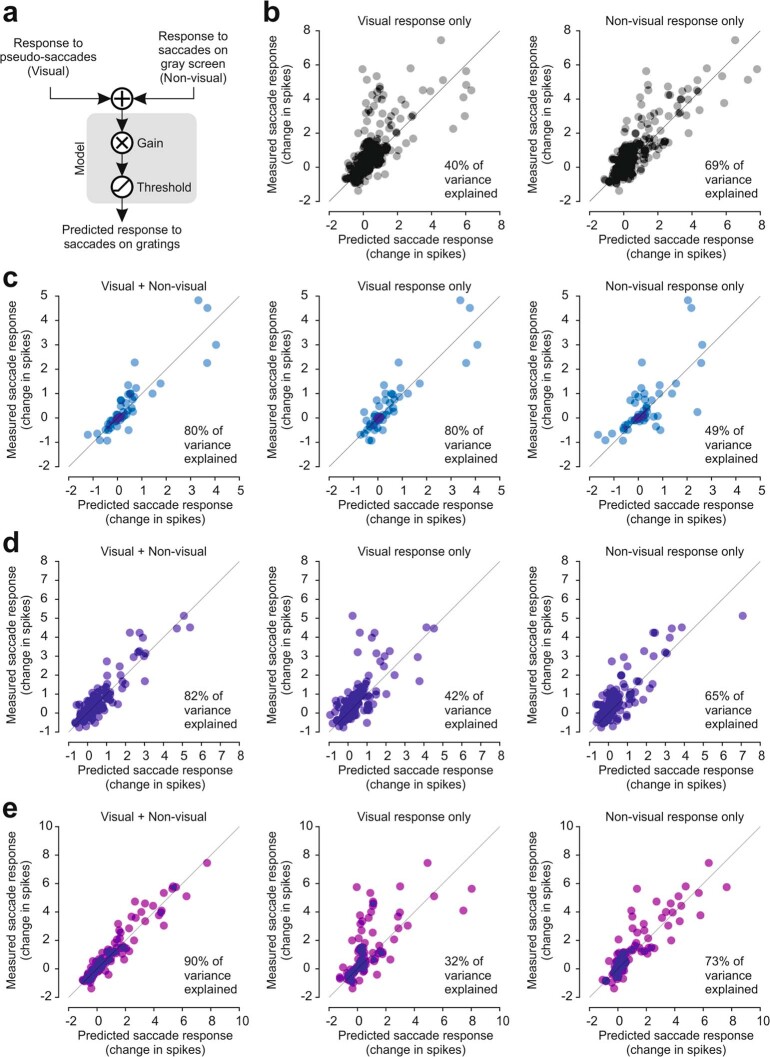
Extended Data Fig. 9. The visual and the non-visual components of the V1 response to saccades each capture only part of the V1 response to saccades on a grating.
a, Schematic of the linear regression-based model used to predict the number of spikes evoked by saccades on a vertical grating. The model is based on the response of neurons to pseudo-saccades (visual component) and to saccades on a gray screen (non-visual component). Results from the sum of the two inputs are shown in Fig. 5g in which the model explains 86% of the observed variance. b, Model prediction results for all neurons that respond to pseudo-saccades and saccades on a gray monitor. Left, predicted number of spikes from the response to pseudo-saccades alone (x-axis) plotted against the observed values (y-axis). This model explains only 40% of the observed variance (gain 0.97, p < 0.0001). Right, predicted number of spikes from the response to saccades on a gray screen alone (x-axis) plotted against the observed values (y-axis). This model explains only 69% of the observed variance (gain 0.89, p < 0.0001). c, Model prediction results for layer 2/3 and 4 neurons that respond to pseudo-saccades and saccades on a gray monitor. Left, predicted number of spikes from the summed response to pseudo-saccades and saccades on a gray monitor (x-axis) plotted against the observed values (y-axis). This model explains 80% of the observed variance (gain 0.49, p < 0.0001). Center, predicted number of spikes from the response to pseudo-saccades alone (x-axis) plotted against the observed values (y-axis). This model explains 80% of the observed variance (gain 0.62, p < 0.0001). Right, predicted number of spikes from the response to saccades on a gray screen alone (x-axis) plotted against the observed values (y-axis). This model explains only 49% of the observed variance (gain 1.49, p < 0.0001). Note the lack of difference in prediction accuracy between the summation model (left) and the visual response model (center). The response to saccades on a grating in layer 2/3 is mainly shaped by the visual inputs. d, Same as in (c), but for layer 5 neurons. Left, gain 0.63, p < 0.0001. Center, gain 1.22, p < 0.0001. Right, gain 0.85, p < 0.0001. Note the increase in prediction accuracy in the summation model (left) compared to the other models. The response to saccades on a grating in layer 5 is shaped by the combination of visual and non-visual inputs. e, Same as in (c), but for layer 6 neurons. Left, gain 0.66, p < 0.0001. Center, gain 1.17, p < 0.0001. Right, gain 0.88, p < 0.0001. Again, note the increase in prediction accuracy in the summation model (left) compared to the other models.

