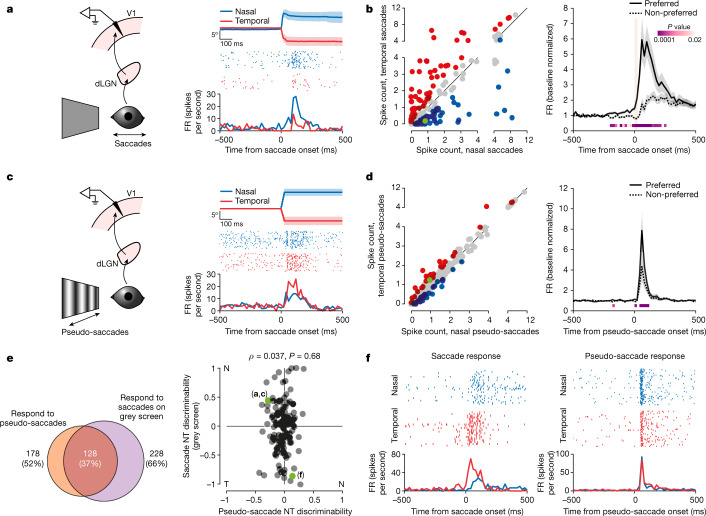
Fig. 3. Direction preferences for saccades and visual motion are not correlated.
a, Left, schematic of V1 recording during saccades on a grey screen. Right, example neuron preferring nasal saccades. Average eye position (top; shaded area, average ± s.d.), raster plots (centre) and the PETH (bottom) are shown. b, Left, scatterplot of the response to nasal and temporal saccades for all responsive neurons (n = 171, 4 mice). Blue, nasal preference; red, temporal preference; grey, no statistical difference; green, example in a. Right, average PETH of discriminating neurons for preferred and non-preferred saccade directions (n = 107 neurons, 4 mice). Shaded area, average ± s.e.m. Orange bar, 0–90% rise time of saccades (25 ms). P values are from the comparison of activity for preferred and non-preferred saccade directions (Wilcoxon signed-rank test, one tailed). c, Left, schematic of V1 recording during pseudo-saccades. Right, same example neuron as in a. This neuron prefers the temporal direction for pseudo-saccades (otherwise as in a). d, Left, scatterplot of the response to nasal and temporal pseudo-saccades (n = 582 neurons, 13 mice, including the 4 mice in b). Blue, nasal preference; red, temporal preference; grey, no statistical difference; green, example in c. Right, average PETH of discriminating neurons (n = 65 neurons; otherwise as in b). e, Left, Venn diagram of the number of neurons that respond to pseudo-saccades, saccades on a grey screen and both. Percentages are out of the entire population; based on four mice from b and d in which the responses to both saccades on a grey screen and pseudo-saccades were tested. Right, scatterplot of NT discriminability for pseudo-saccades (x axis) against saccades on a grey screen (y axis), for neurons that respond to both (128 neurons in e). n = 128 neurons, 4 mice. NT discriminability reports how well an ideal observer distinguishes between nasal and temporal saccades on the basis of spike counts (negative, temporal preference; positive, nasal preference; 0, no preference; Methods). For this analysis, amplitudes and directions for pseudo-saccades were matched to those of real saccades on the grey screen. Green, example neurons in a, c and f. f, Example neuron showing altered direction preference for real saccades (left) and pseudo-saccades (right). Top, raster plots; bottom, PETHs.

