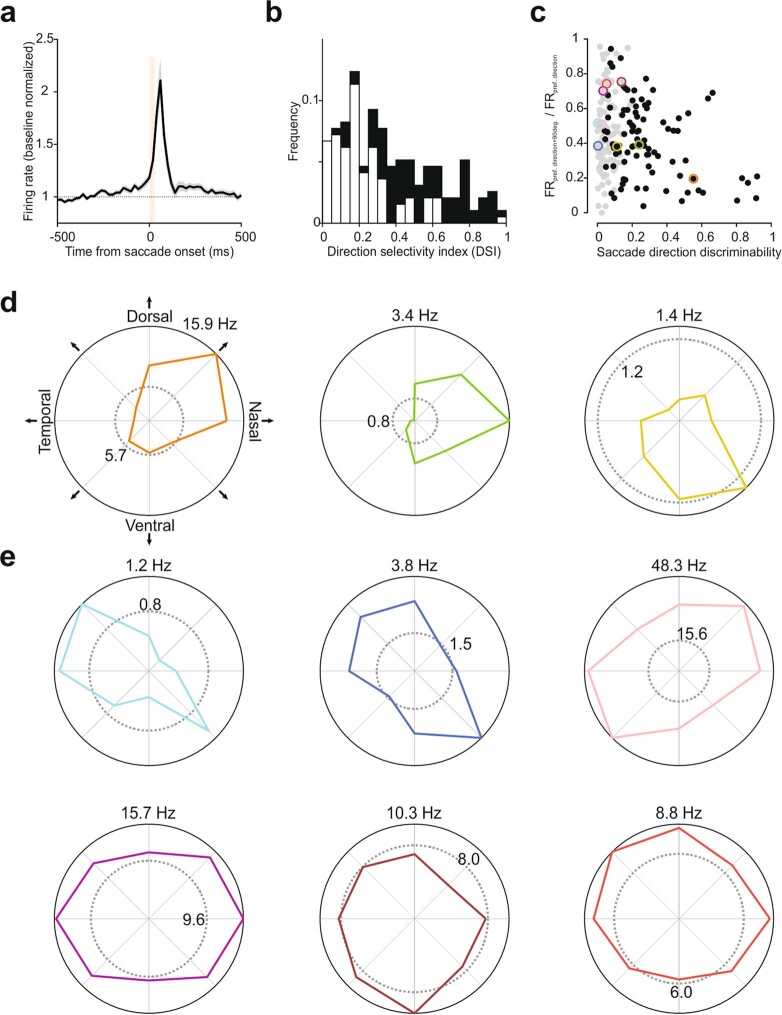
Extended Data Fig. 1. Response of V1 neurons to saccades in freely moving mice.
a, Average PETH of saccade responsive neurons (n = 194 neurons, 10 mice). For each neuron, the saccade direction with maximum response was taken. Baseline normalized. Shaded area, average ± s.e.m. Vertical orange bar, 0 – 90% rise time of saccades (31 ms). b, Histogram of classical direction selectivity index (see Methods). White, non-direction selective (n = 104 neurons); black, saccade direction selective (n = 90 neurons). c. Scatter plot of saccade responsive neurons, showing the gradient of response profiles. X-axis, saccade direction discriminability; y-axis, ratio of the FR between the direction orthogonal to the preferred and the preferred. Gray, non-direction selective; black, direction selective. Data points in colored circles correspond to example units shown in (d) and (e). d, Polar plots of example saccade direction selective neurons. Dotted gray circle, baseline FR averaged for all directions. FR for the preferred direction is shown at the top of the polar plots. e, Same as (d), but for non-direction selective neurons.

