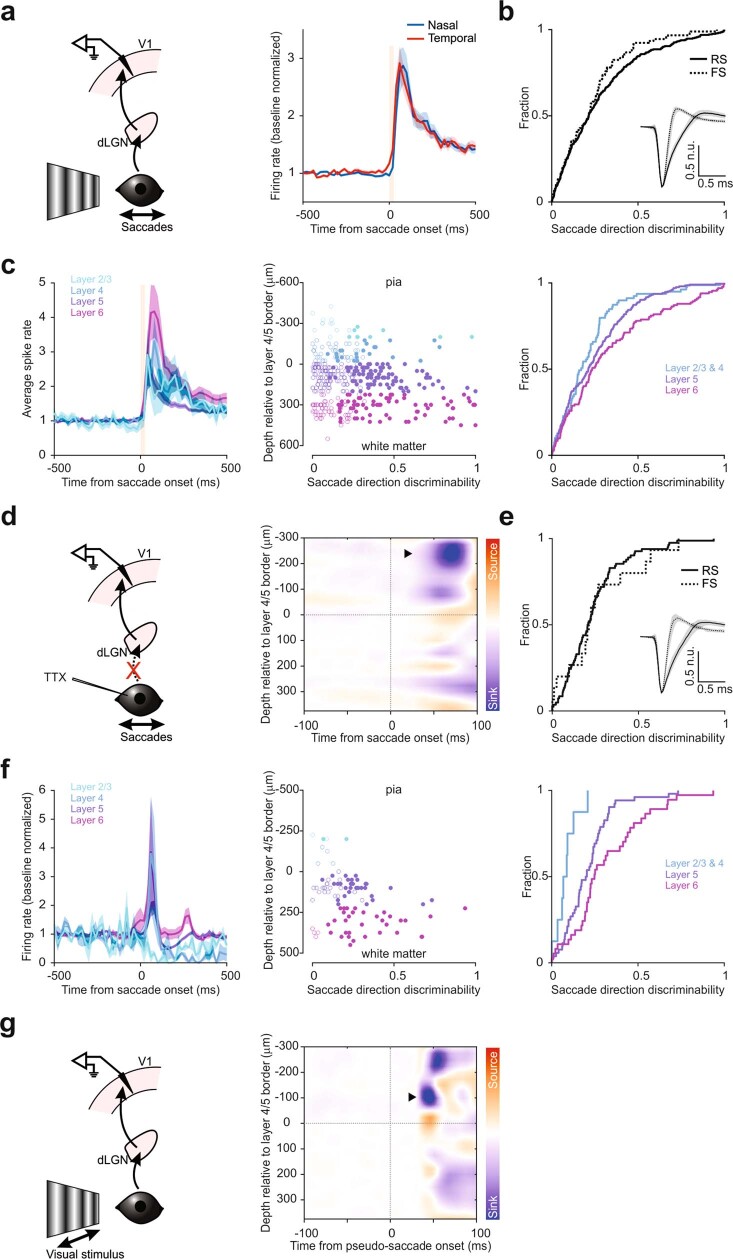
Extended Data Fig. 4. Saccade response across cortical depth and neuron class in control and TTX-blinded mice.
a, Left, schematic of V1 recording during saccades on a vertical grating. Right, average PETH of saccade responsive neurons to nasal and temporal saccades. Baseline normalized. Shaded area, average ± s.e.m. Vertical orange bar, 0–90% rise time of saccades for reference (26 ms). Note the similarity of the population averaged response to nasal and temporal saccades. b, Cumulative frequency distribution (CFD) of direction discriminability (see Methods), plotted for saccade responsive regular-spiking (RS) and fast-spiking (FS) neurons. Overall, 53% (324 out of 607) and 82% (91 out of 111) of RS and FS neurons, respectively, responded to saccades. Anderson-Darling test, p = 0.29, n = 607 for RS, 111 for FS, 13 mice. Inset, median spike shape normalized to the trough. Shaded area, interquartile range. c, Left, average PETH of saccade responsive V1 neurons, sorted by cortical depth. All nasal and temporal saccades are included. Layer 2/3, 21 responsive neurons out of 54; layer 4, 58 out of 121; layer 5, 204 out of 334; layer 6, 132 out of 209. Baseline normalized. Shaded area, average ± s.e.m. Vertical orange bar, 0–90% rise time of saccades for reference (26 ms). Center, scatter plot of direction discriminability (x-axis) of all units as a function of cortical depth (y-axis). Open circles, statistically non-significant; filled, significant (see Methods). Color code as in left. Right, CFD of discriminability by cortical depth. Layers 2/3 and 4 were grouped together. 3-sample Anderson-Darling test, p < 0.0001. d, Left, schematic of V1 recording during saccades in TTX-blinded animals. Right, heat map of the current source density (CSD) analysis from an example animal. Note major sink in the supragranular layers (arrowhead). Data from 89 nasal and 82 temporal saccades. e, Cumulative frequency distribution (CFD) of saccade direction discriminability, plotted for saccade responsive RS and FS neurons in TTX-blinded animals. Overall, 42% (82 out of 194) and 48% (15 out of 31) of RS and FS neurons, respectively, responded to saccades. Anderson-Darling test, p = 0.313, n = 194 for RS, 31 for FS. Inset, median spike shape normalized to the trough. Shaded area, interquartile range. f, Left, average PETH of saccade responsive V1 neurons in TTX-blinded animals, sorted by cortical depth. All nasal and temporal saccades are included. Layer 2/3, 4 responsive neurons out of 13; layer 4, 4 out of 28; layer 5, 52 out of 119; layer 6, 37 out of 65. Shaded area, average ± s.e.m. Center, scatter plot of direction discriminability of all neurons (x-axis) as a function of cortical depth (y-axis). Open circles, statistically non-significant; filled, significant (see Methods). Color code as in left. Right, CFD of discriminability by cortical depth. Layers 2/3 and 4 were grouped together. 3-sample Anderson-Darling test, p = 0.0005. g, Same as in (d), but for visual stimuli in a control animal. The visual stimuli used here were pseudo-saccades, i.e., quick shifts of the grating that mimic visual scene changes induced by real saccades (see Main and Methods). Note early sink in layer 4 (arrowhead). Color scale same as in (d).

