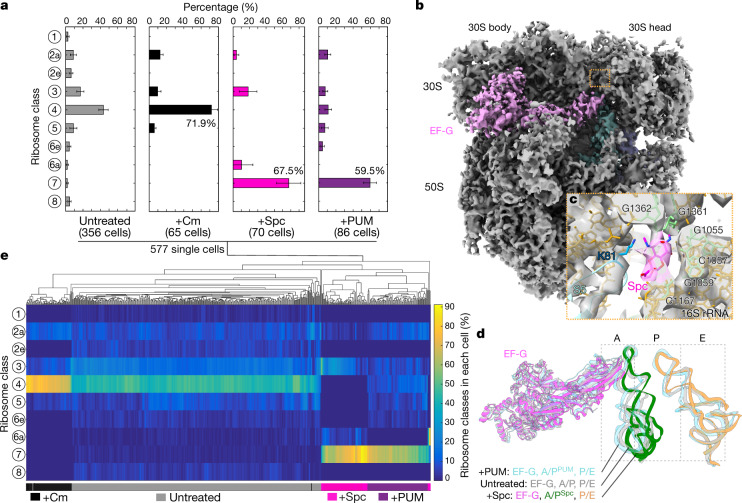
Fig. 3. Antibiotics induce distinct translation elongation landscapes in cells.
a, Distribution of translation elongation intermediates in native untreated cells, and in cells treated with three different antibiotics. Bar and whiskers indicate mean and s.d. for each class across all cells in the different treatment groups: untreated (n = 356 cells); +Cm, chloramphenicol-treated (n = 65 cells); +Spc, spectinomycin-treated (n = 70 cells); and +PUM, pseudouridimycin-treated (n = 86 cells). b, Ribosomes in Spc-treated cells are largely stalled in the 'EF-G, A/PSpc, P/E' state. c, The Spc molecule (magenta) is well-resolved and built in the 'EF-G, A/PSpc, P/E' ribosome model. It is surrounded by several 16S rRNA bases and loop 2 of ribosomal protein S5 near the 30S neck. d, The major state in Spc-treated cells is similar to the 'EF-G, A/PPUM, P/E' class in PUM-treated cells (light blue) and the 'EF-G, A/P, P/E' class in untreated cells (light grey), differing only in the position of the A/P-site tRNA on the 50S side. e, Single-cell clustering analysis on the basis of the translation elongation states of 577 individual cells under native and different antibiotic treatment conditions.

