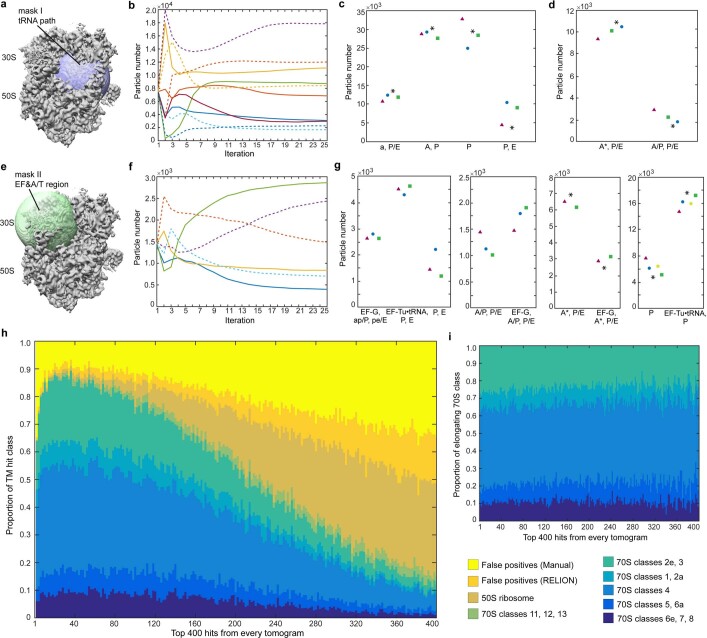
Extended Data Fig. 5. Validation of ribosome detection and classification.
a, Mask I for focused classification on tRNA path region. b, A representative RELION classification job with mask I. Each line indicates the change in particle numbers in one class over 25 iterations. Classes that show the same structure were grouped according to the tRNA occupancy ('a, P/E', 'P, E', 'P', 'A, P'). 'a, P/E' contains heterogeneous density around the A site. c, Results of the classification job as shown in b, and of three additional parallel jobs. d, Results of following classification jobs that further classify the 'a, P/E' class into 'A*, P/E' and 'A/P, P/E'. e, Mask II for focused classification on elongation factor (EF) and A/T tRNA sites. f, Changes in particle numbers over iterations in a representative classification job with the mask II. g, Results of parallel focused classification jobs with mask II. h, Distribution of the ribosome classes against template matching cross-correlation scores used for ribosome localization. For each of the 356 tomograms of untreated cells, the 400 highest scoring hits were extracted and ranked. Obvious false positives were manually excluded first. Additional false positives were identified during RELION classification. 70S classes that are structurally similar were grouped in the plot for better visualization. i, Same as h, but only showing the 70S classes in the elongation phase. The proportions of different 70S classes remain stable across the top 400 hits, demonstrating that the classification results are not biased by the ribosome picking.

