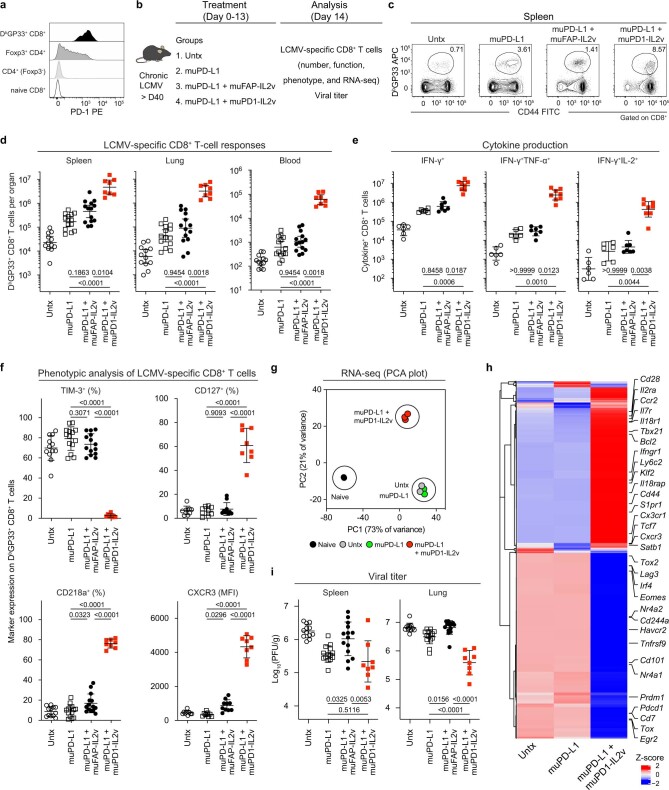
Extended Data Fig. 5. Comparative analysis of muPD1-IL2v versus muFAP-IL2v in combination therapy with muPD-L1 during chronic LCMV infection.
a, Representative histogram for expression of PD-1 by DbGP33+ CD8+ T cells, Foxp3+ CD4+ T cells (Tregs), conventional (Foxp3−) CD4+ T cells, and naïve (CD44lo) CD8+ T cells. All T cells except naïve CD8+ T cells were isolated from spleens of chronically LCMV-infected mice (> day 40 post-infection). Naïve CD8+ T cells were isolated from uninfected C57BL/6J mice. The results are representative of two experiments (n = 6 for chronically LCMV-infected mice and n = 2 for uninfected mice). b, Chronically LCMV-infected mice (> day 40 post-infection) were treated with muPD-L1, muPD-L1 + muFAP-IL2v, and muPD-L1 + muPD1-IL2v for 2 weeks and then analyzed for CD8 T-cell responses and viral titer. c, Representative FACS plots for DbGP33+ CD8+ T cells in spleen. d, Numbers of DbGP33+ CD8+ T cells in the indicated tissues. e, Numbers of IFN-γ+, INF-γ+TNF-α+, and INF-γ+IL-2+ LCMV-specific CD8+ T cells in spleen. f, Phenotypic marker expression on DbGP33+ CD8+ T cells in spleen. g, PCA plot of RNA-seq for naïve CD8+ T cells from uninfected mice and DbGP33+ CD8+ T cells from chronically LCMV-infected mice after the indicated treatments. h, Heat map showing mean relative expressions of all differentially expressed genes (n = 1954) across treatment groups. i, Viral titer in the indicated tissues. Results were pooled from 3–5 experiments with n = 2–5 mice per group in each experiment (c–f, i). RNA-seq data for groups of naive, Untx, and muPD-L1 were obtained from GSE206722. RNA-seq data for muPD-L1 + muPD1-IL2v group were generated from biological triplicates with n = 2 mice per replicate (g,h). Data are presented as geometric mean and 95% CI (d,e) or mean and SD (f,i) with p values. Statistical comparisons were performed using Kruskal-Wallis test with Dunn’s multiple comparison test (d,e), one-way ANOVA with Tukey’s multiple comparison test (f,i). Untx, untreated.

