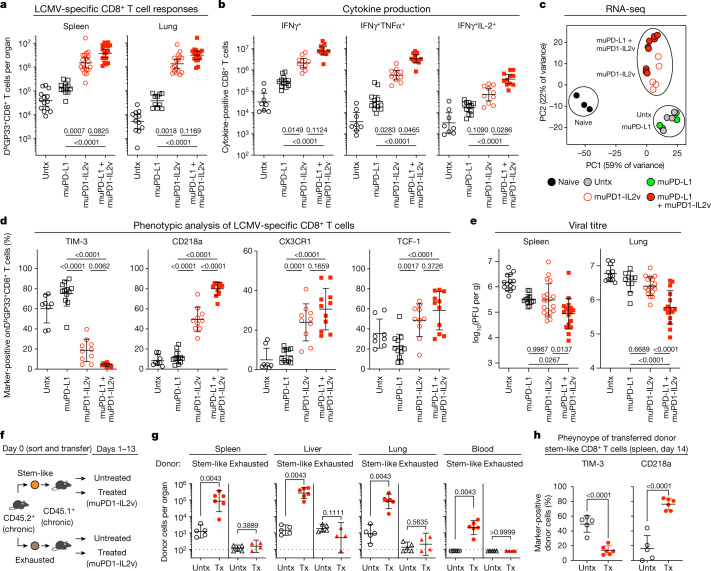
Fig. 2. Targeted delivery of IL-2v to PD-1+ T cells using the muPD1-IL2v construct increases LCMV-specific CD8+ T cell responses and improves viral control during chronic infection by enhancing the proliferation and differentiation of PD-1+TCF-1+ stem-like resource CD8+ T cells.
Chronically LCMV-infected mice (more than 40 d after infection) were left untreated (Untx) or treated with muPD-L1, muPD1-IL2v or muPD-L1 + muPD1-IL2v for 2 weeks and then analysed for CD8+ T cell responses and viral titre. a, Numbers of DbGP33+CD8+ T cells in the indicated tissues. b, Number of IFNγ+, IFNγ+TNFα+ and IFNγ+IL-2+ LCMV-specific CD8+ T cells in the spleen. c, PCA plot of RNA-seq data for naive CD8+ T cells from uninfected mice and DbGP33+CD8+ T cells from chronically LCMV-infected mice after the indicated treatments. d, Phenotypic marker expression on DbGP33+CD8+ T cells in the spleen. e, Viral titre in the indicated tissues. PFU, plaque-forming units. f, Experimental design for T cell transfer experiments. Sorted stem-like (PD-1+CXCR5+TIM-3−) and exhausted (PD-1+CXCR5−TIM-3+) CD8+ T cells isolated from CD45.2+ chronically LCMV-infected mice (more than 40 d after infection) were adoptively transferred into infection-matched CD45.1+ recipient mice, followed by muPD1-IL2v therapy for 2 weeks. g, Numbers of donor CD45.2+CD8+ T cells in various tissues. The dotted line on the y axis indicates the limit of detection for the number of donor cells. Tx, treated. h, TIM-3 and CD218a expression on transferred donor stem-like CD45.2+CD8+ T cells in the spleen of recipients after 2 weeks of treatment. Results were pooled from 4–7 experiments with n = 2–4 mice per group in each experiment (a,b,d,e) or from two experiments with n = 4–6 mice per group (g,h). RNA-seq data are from Extended Data Fig. 5 and additional samples from six experiments to obtain various CD8+ T cell populations with n = 1–15 mice per group in each experiment (c). Data are presented as the geometric mean and 95% confidence interval (CI) (a,b,g) or the mean and s.d. (d,e,h) with P values. Statistical comparisons were performed using the Kruskal–Wallis test with Dunn’s multiple-comparisons test (a,b), one-way ANOVA with Tukey’s multiple-comparisons test (d,e), the Mann–Whitney test (two tailed) (g) or an unpaired two-tailed t test (h).

