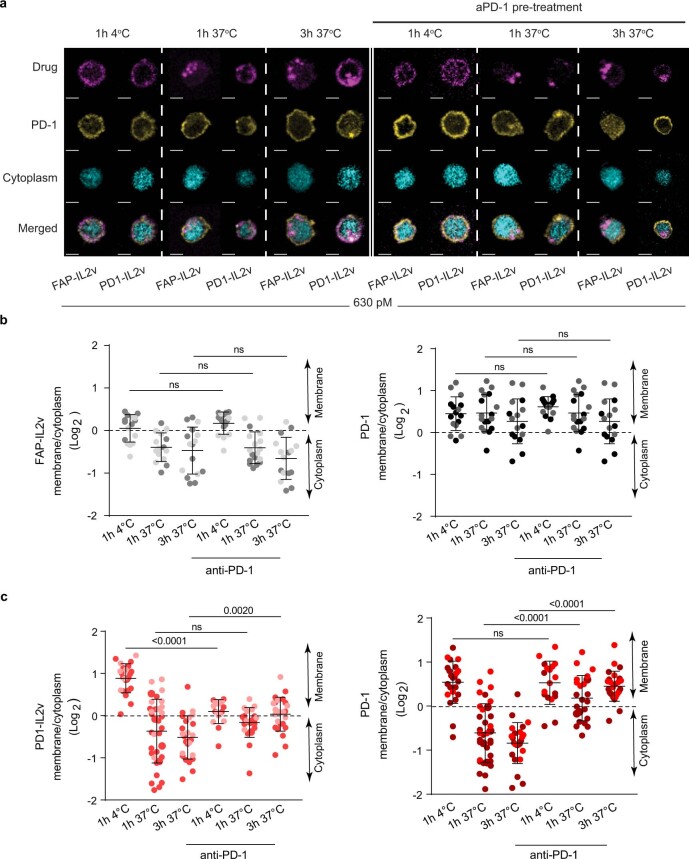
Extended Data Fig. 3. PD1-IL2v is internalized upon binding to PD-1 and IL-2Rβγ and drives the internalization of the bound PD-1 receptors.
a. Representative confocal images of IL2v and PD-1 receptor internalization kinetics at 37 °C in in vitro activated polyclonal PD-1+ CD4 T cells upon incubation with 630 pM of PD1-IL2v or FAP-IL2v for 1 or 3 h, with or without anti-PD1 pre-treatment to prevent PD-1 binding by PD1-IL2v. PD1-IL2v and FAP-IL2v are in pink, PD-1 surface staining in yellow, and the cytoplasm is in cyan. b–c. Quantification of average drug intensity in membrane/cytoplasm (Log2). Log2 = 0: Equal amount of drug at the membrane and in the cytoplasm (dotted line). Log2>0: More drug is on the membrane. Log2<0: Drug localizes in the cytoplasm. Each dot represents quantification from a single CD4 T cell; clear and dark dots indicate T cells derived from two different donors, from 2 independent experiments. Mean and SD are shown. One-way ANOVA with a post hoc Tukey multiple comparison test.

