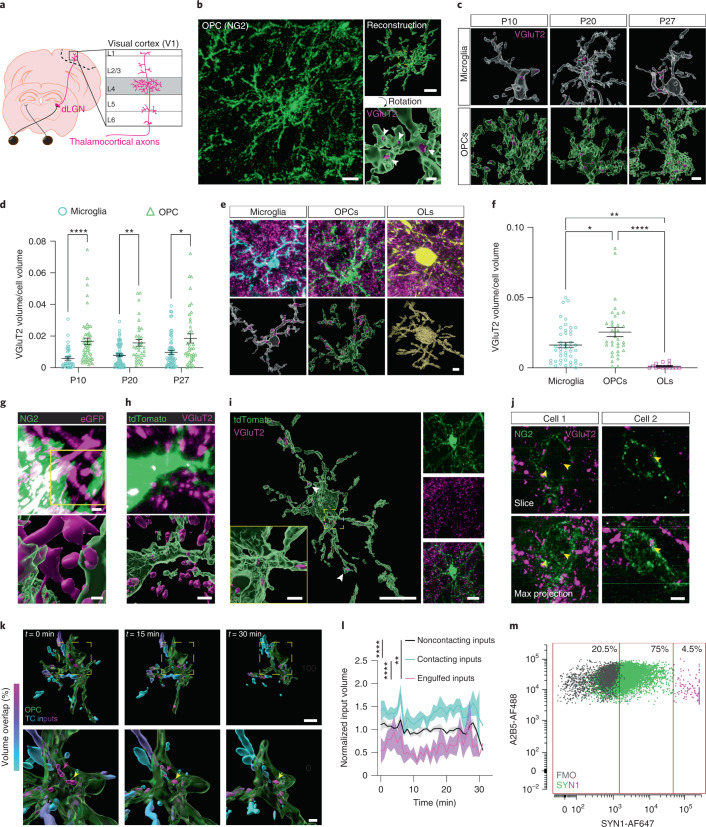
Fig. 1. OPCs engulf TC synaptic inputs in V1.
a, Schematic of TC inputs terminating in mouse V1. b, Confocal image and volumetric reconstructions of an OPC (NG2, green) containing TC inputs (VGluT2, magenta and white arrowheads). Scale bars, 10 μm, 5 μm (inset top) and 2 μm (inset bottom). c, Reconstructions of microglia (Iba1, white) and OPCs (NG2, green) containing TC inputs (VGluT2, magenta) during development. Scale bar, 5 μm. d, Quantification of synaptic material within microglia and OPCs. Two-way ANOVA with Geisser–Greenhouse correction (cell type: P < 0.0001; age: P = 0.6225; interaction: P = 0.1776) and Šídák multiple comparisons. n (microglia/OPCs): P10 = 38/53, P20 = 63/35 and P27 = 60/39, from three mice per group. e, Images and reconstructions of a microglia (Iba1, cyan), an OPC (green) and a mature oligodendrocyte (yellow) in an adult NG2-CreERT2tdTomato mouse, stained for TC inputs (VGluT2, magenta). Scale bar, 5 µm. OLs, oligodendrocytes. f, Quantification of the volume of synaptic material contained within microglia, OPCs and oligodendrocytes. One-way ANOVA (P < 0.0001) with Tukey’s posthoc test; n (microglia/OPCs/OLs) = 45/34/14 from three mice per group. g, Image and reconstruction of an OPC (NG2, pseudocolored green) containing AAV-hSYN-eGFP+ TC inputs (pseudocolored magenta). Scale bars, 2 μm. h, Image and reconstruction of an OPC (tdTomato, green) containing VGluT2-stained inputs (magenta). Scale bar, 2.5 μm. i, An OPC (tdTomato, green) and internalized inputs (VGluT2, magenta; white arrowheads) imaged on an Airyscan microscope. Scale bars, 10 µm, 1 µm (inset) and 10 µm (right). j, OPCs (NG2, green) and inputs (VGluT2, magenta; yellow arrowheads) imaged on a STED microscope. Scale bar, 2 µm. k, Reconstructions of an OPC (green) interacting with inputs colored based on the percentage of fluorescence overlap with the OPC (magenta 100% overlap, cyan 0% overlap). Images taken from a 30-min time-lapse session shown in Supplementary Video 1. Scale bars, 10 μm (top) and 5 μm (bottom). Yellow and magenta arrowheads indicate engulfed inputs that were present throughout or disappeared during the imaging session, respectively. l, Average volumes of inputs based on their contact with OPCs. Lines represent mean and shaded areas represent s.e.m. Two-tailed Friedman test (P < 0.0001) with Dunn’s multiple-comparison correction. n = 6 videos taken from three mice. m, Flow cytometry plot demonstrating presence of the presynaptic marker SYNAPSIN (SYN1hi) within OPCs (A2B5hi). FMO, fluorescence minus one control condition. Data points are colored based on the amount of SYN contained within each OPC. In d and f, individual data points are shown with bars representing mean ± s.e.m. *P < 0.05, **P < 0.01, ****P < 0.0001.

