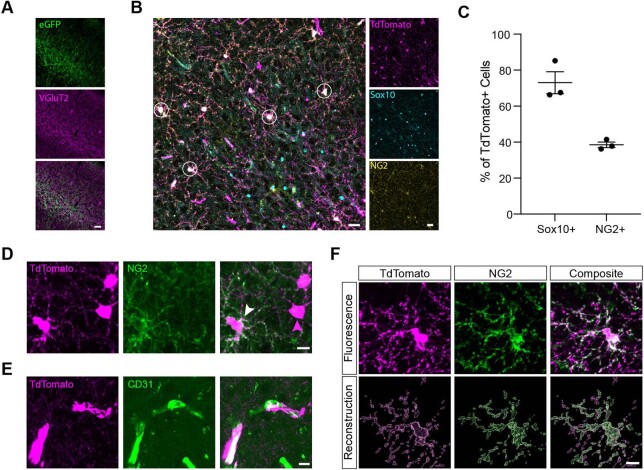
Extended Data Fig. 1. Validation of the OPC reporter line.
(a) Confocal images of TC axons and inputs in V1 labeled with AAV-hSYN-eGFP (green) and immunostained for VGluT2 (magenta). Scale bar, 40 μm. (b) Representative image of tdTomato+ cells (magenta) in the NG2-CreERT2tdTomato mouse line. Cells of the oligodendrocyte lineage immunostained for Sox10 (cyan) and the OPC marker NG2 (yellow). White circles, OPCs confirmed by co-expression of tdTomato and NG2. Scale bar, 20 μm. Fluorescence scale bar, 40 μm. (c) Quantification of the percentages of tdTomato+ cells that co-stain for Sox10 and NG2. Individual data points and mean ± s.e.m. shown; n = 3 mice per group. (d) High resolution images of tdTomato+ cells (magenta) immunostained for NG2 (green). White arrow, confirmed OPC in which tdTomato and NG2 signal overlap. Compared to other tdTomato+ cells (magenta arrow), OPCs can be distinguished by their bean-shaped somata. Scale bar, 10 μm. (e) Confocal images of tdTomato+ cells (magenta) co-localizing with blood vessels (CD31, green). These are likely pericytes and are easy to distinguish from OPCs based upon morphology. Scale bar, 10 μm. (f) High magnification image of a tdTomato+ OPC (magenta) immunostained for NG2 (green). Bottom, volumetric reconstructions of the same cell based upon tdTomato versus NG2 signal, demonstrating a high level of overlap between the two channels. Scale bar, 10 μm.

