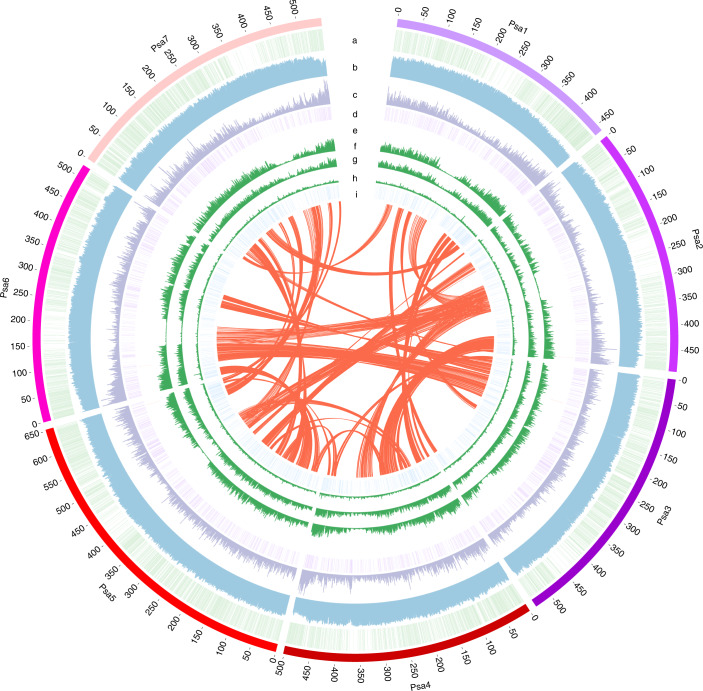
Fig. 1. Overview of the pea genome assembly.
The outer layer of colored blocks is a circular representation of seven chromosomes. a = the genetic markers, b = repeat density, c = gene density calculated in 1,000-kb windows sliding in 500-kb steps, d = tandem duplicated genes, e = Mendel’s genes (red lines); f, g and h = the nucleotide diversity (π) of the three species within Pisum (P. sativum (64), P. fulvum (22) and P. abyssinicum (15)) based on population genetic structure analyses, and i = transcription factors. The innermost layer shows interchromosomal synteny.

